Create Sample Level Heat Map for RNA-Seq
Create Sample Level Heat Map for RNA-Seq takes at least two Expression tracks (![]() ) and creates a heat map that displays the distances between samples with respect to their feature expression profiles. Each track represents a sample in the heat map. See The sample level heat map view for details.
) and creates a heat map that displays the distances between samples with respect to their feature expression profiles. Each track represents a sample in the heat map. See The sample level heat map view for details.
To run the tool, go to:
Tools | RNA-Seq and Small RNA Analysis (![]() )| Expression Plots (
)| Expression Plots (![]() ) | Create Sample Level Heat Map for RNA-Seq (
) | Create Sample Level Heat Map for RNA-Seq (![]() )
)
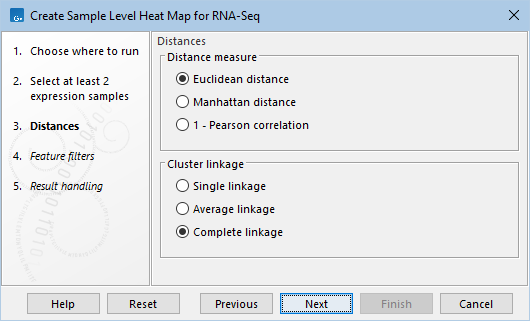
The following options for performing hierarchical clustering for the samples (see Normalization and clustering) can be configured in the Distances dialog (figure 33.71):
- Distance measure for calculating distances between samples:
- Euclidean distance
- 1 - Pearson correlation
- Manhattan distance
- Cluster linkage for calculating distances between clusters:
- Single linkage
- Average linkage
- Complete linkage

Figure 33.71: Distance options used to create the heat map.
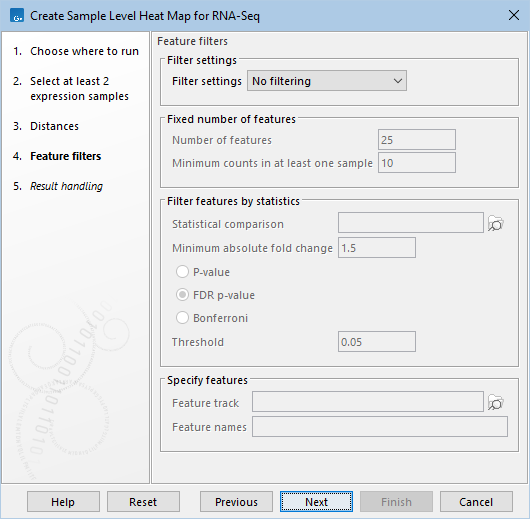
The following options for filtering the features used to create the heat map can be configured in the Feature filters dialog (figure 33.72):
- No filtering. All features are kept.
- Fixed number of features. A specified number of features are kept.
- Number of features. This number of features with the highest index of dispersion (variance to mean ratio) are kept. Raw count values (not normalized) are used to calculate this index.
- Minimum counts in at least one sample. Only features with at least this raw count value in one sample are kept.
- Filter features by statistics. Features that are differentially expressed according to the specified thresholds are kept.
- Statistical comparison. A Statistical Comparison Track (
 ), see Output of the Differential Expression tools.
- Minimum absolute fold change. Only features with at least this absolute fold change are kept.
- Threshold. Only features with at most this p-value are kept. The type of the p-value can be set to P-value, FDR p-value, or Bonferroni.
- Statistical comparison. A Statistical Comparison Track (
- Specify features. A set of specified features are kept.
- Feature track. An Annotation Track (
 ). All features in this track are kept.
- Feature names. Features with names in the list of case-sensitive names are kept. Any white-space characters, comma, and semicolon are accepted as separators.
- Feature track. An Annotation Track (

Figure 33.72: Feature filtering options.
Subsections
