Bioinformatics explained: Sequence logo
In the search for homologous sequences, researchers are often interested in conserved sites/residues or positions in a sequence which tend to differ a lot. Most researchers use alignments (see bioinformatics explained: multiple alignments) for visualization of homology on a given set of either nucleotide or protein sequences. In proteins, active sites in a given protein family are often highly conserved. Thus, in an alignment these positions (which are not necessarily located in proximity) are fully or nearly fully conserved. On the other hand, antigen binding sites in the F![]() unit of immunoglobulins tend to differ quite a lot, whereas the rest of the protein remains relatively unchanged.
unit of immunoglobulins tend to differ quite a lot, whereas the rest of the protein remains relatively unchanged.
In DNA, promoter sites or other DNA binding sites are highly conserved (see figure 25.9). This is also the case for repressor sites as seen for the Cro repressor of bacteriophage ![]() .
.
When aligning such sequences, regardless of whether they are highly variable or highly conserved at specific sites, it is very difficult to generate a consensus sequence which covers the actual variability of a given position. In order to better understand the information content or significance of certain positions, a sequence logo can be used. The sequence logo displays the information content of all positions in an alignment as residues or nucleotides stacked on top of each other (see figure 25.9). The sequence logo provides a far more detailed view of the entire alignment than a simple consensus sequence. Sequence logos can aid to identify protein binding sites on DNA sequences and can also aid to identify conserved residues in aligned domains of protein sequences and a wide range of other applications.
Each position of the alignment, and consequently the sequence logo, shows the sequence information in a computed score based on Shannon entropy [Schneider and Stephens, 1990]. The height of the individual letters represents the sequence information content in that particular position of the alignment.
A sequence logo is a much better visualization tool than a simple consensus sequence. An example hereof is an alignment where in one position a particular residue is found in 70% of the sequences. If a consensus sequence is used, it typically only displays the single residue with 70% coverage. In figure 25.9, an un-gapped alignment of 11 E. coli start codons including flanking regions are shown. In this example, a consensus sequence would only display ATG as the start codon in position 1, but when looking at the sequence logo it is seen that a GTG is also allowed as a start codon.
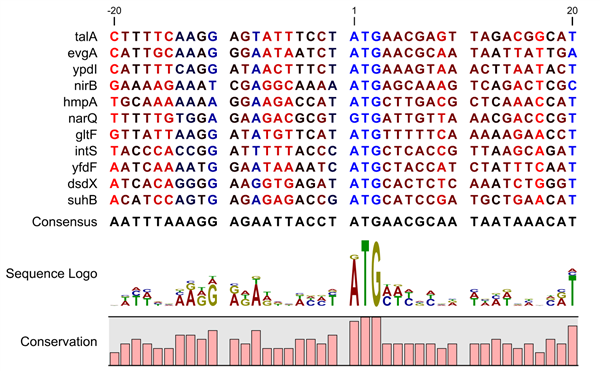
Figure 25.9: Ungapped sequence alignment of 11 E. coli sequences defining a start codon (starting at position 1). Below the alignment is shown the corresponding sequence logo. As seen, a GTG start codon and the usual ATG start codon are present in the alignment. This can also be visualized in the logo at position 1.
Calculation of sequence logos
A comprehensive walk-through of the calculation of the information content in sequence logos is beyond the scope of this document but can be found in the original paper by [Schneider and Stephens, 1990]. Nevertheless, the conservation of every position is defined as ![]() which is the difference between the maximal entropy (
which is the difference between the maximal entropy (![]() ) and the observed entropy for the residue distribution (
) and the observed entropy for the residue distribution (![]() ),
),
![]() is the observed frequency of an amino acid residue or nucleotide of symbol
is the observed frequency of an amino acid residue or nucleotide of symbol ![]() at a particular position and
at a particular position and ![]() is the number of distinct symbols for the sequence alphabet, either 20 for proteins or four for DNA/RNA. This means that the maximal sequence information content per position is
is the number of distinct symbols for the sequence alphabet, either 20 for proteins or four for DNA/RNA. This means that the maximal sequence information content per position is
![]() for DNA/RNA and
for DNA/RNA and
![]() for proteins.
for proteins.
The original implementation by Schneider does not handle sequence gaps. In CLC Genomics Workbench, we have slightly modified the algorithm so an estimated logo is presented in areas with sequence gaps. If amino acid residues or nucleotides of one sequence are found in an area containing gaps, we have chosen to show the particular residue as the fraction of the sequences. For example, if one position in the alignment contains 9 gaps and only one alanine (A) the A represented in the logo has a height of 0.1.
See also [Crooks et al., 2004].