
Reads tracks
Reads tracks can be included in a track list with other tracks that are based on a compatible genome, allowing for convenient, comparative visual analysis. For example, the track list shown in figure 31.20 contains, from top to bottom, a cytoband overview, a reads track, an annotation track of target regions, and a variant track.
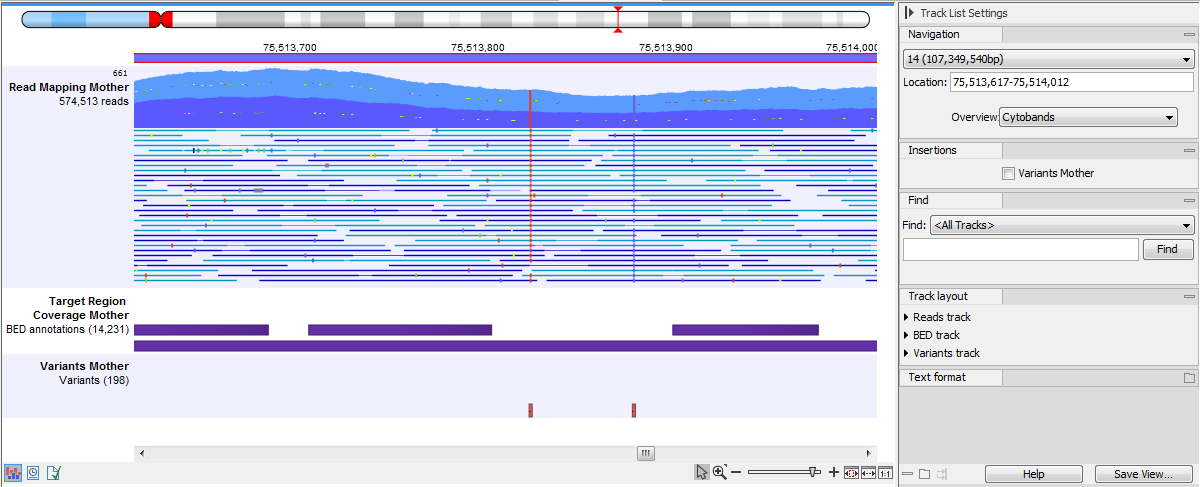
Figure 31.20: A track list containing a reads track, an annotation track and a variant track.
Reads tracks contain only the reads, placed where they mapped using the relevant reference genome coordinates. The information available when viewing a reads track depends on how far you zoom out or in.
Zooming out to an aggregated view
When zoomed out to the point where the mapped reads are aggregated (figure 31.21), the height of the graph reflects the read coverage of that region, with the shade of blue representing the maximum, average and minimum coverage of the positions in that region:
- Dark blue: maximum read coverage
- Royal blue: average read coverage
- Light blue: minimum read coverage
A tooltip is shown when hovering the mouse cursor over any position in the track, reporting these values and the length of the region where those values apply.
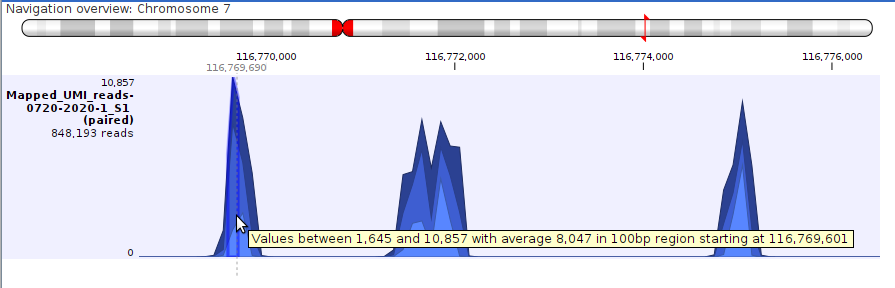
Figure 31.21: Shades of blue in an aggregated reads track represent the maximum, average and minimum reads coverage. Hovering the mouse cursor over a position brings up a tooltip with informaton about the coverage in that region.
Zooming in to a detailed view
When zoomed in, reads are represented on individual lines, with individual bases visible when zoomed in far enough (figure 31.22). Some reads are shown in detail, with the rest summarized in a coverage graph above. Increasing the height of the reads track allows more reads to be seen in detail. For mappings where the coverage is deeper than the track height, a vertical scrollbar will appear when hovering the mouse cursor over the right hand side of the reads track. Use this to scroll through and view the details of all reads in the reads track.
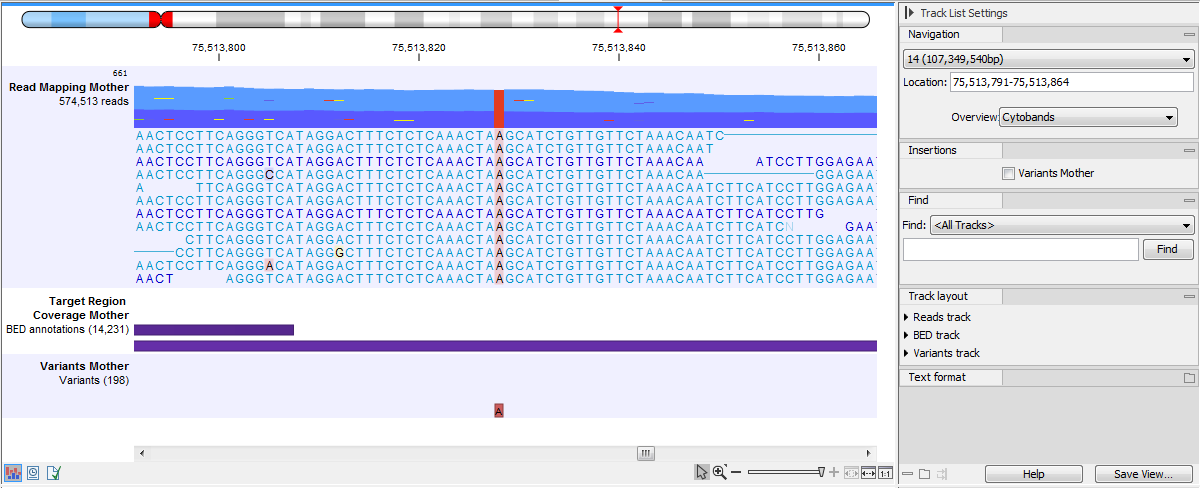
Figure 31.22: Zoom in fully to see the nucleotide bases of each read.
Reads that map across the origin of circular genomes are displayed at both the start and end of the mapping, and are marked with double arrows » at the ends of the read to indicate that the read continues at the other end of the reference sequence.
When zoomed in to a level where individual reads can be seen, you can right-click on a read and choose the option Selected Read from the menu that appears. This opens a submenu with options to copy the read, open it in a new view, or using it as a query in a BLAST search (figure 31.23).
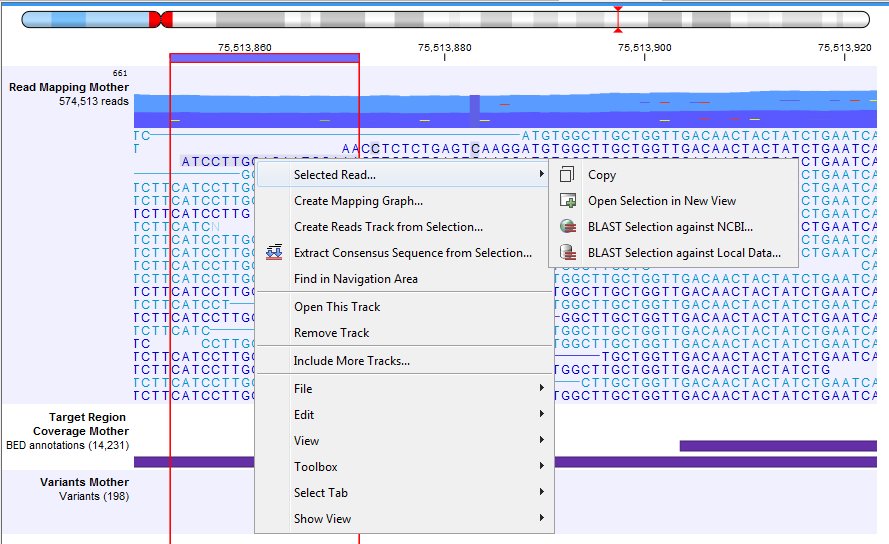
Figure 31.23: Right click on an individual read to reveal menu options for actions that can be taken using that read.
Tooltips in Reads Tracks
When the reads are aggregated, hovering the mouse cursor over the reads track reveals a tooltip with general information about that region (figure 31.21).
When zoomed in close enough to see individual reads, hovering the mouse cursor over the reads track reveals a tooltip with information about the reads supporting certain base calls, or a deletion, at that position, as well as the directions of those reads (figures 31.24 and 31.25). For overlapping paired reads that disagree, ambiguous bases are represented by their IUPAC codes. Use 'Show strands of paired reads' to show all bases from overlapping paired reads, see Overlapping paired reads for more information.
Symbols used in these tooltips include the following:
- + for single-end read mapped in forward direction, i.e., the number of green reads
- - for single-end read mapped in reverse direction, i.e., the number of red reads
- p+ for paired-end read mapped in forward direction (one count per pair), i.e., the number of dark blue reads
- p- for paired-end read mapped in reverse direction (one count per pair), i.e., the number of light blue reads
- ? for reads mapped in multiple places, i.e., the number of yellow reads
Tooltips over regions where at least one read contains an insertion include information relating to read content in that insertion region (figure 31.26). This information is best considered in combination with information in tracks generated by tools dedicated to calling variants, within the context of a track list.
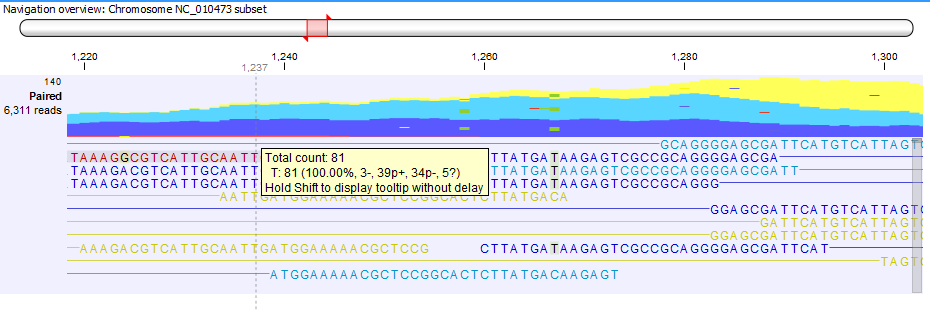
Figure 31.24: Example of tooltip information in a non-aggregated view of a reads track containing paired reads.
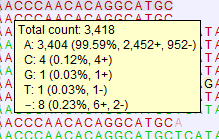
Figure 31.25: Example of tooltip information in a non-aggregated view of a reads track containing single reads. In this example, 8 reads support a deletion.
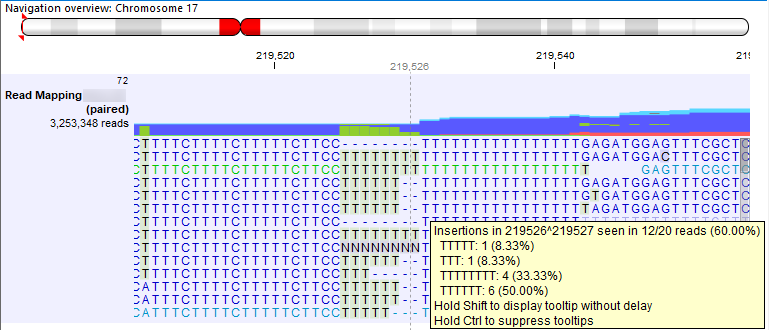
Figure 31.26: Example of tooltip information in a non-aggregated view where the mouse cursor is positioned over a region where 12 reads include a homopolymeric T insertion relative to the reference.
Tip: With larger mappings, there can be a short delay before the tooltip appears. To speed this up, click on the Shift key while moving the mouse over the reads. Tooltips then appear without delay.
For information on the side panel settings for reads tracks, see Reads tracks Side Panel settings.
Subsections