Mapped read statistics
This section contains simple statistics for all mapped reads, non-specific matches (reads that match more than place during the assembly), non-perfect matches (reads with one or more mismatches or gaps relative to the reference sequence) and paired reads.
Note! Paired reads are counted as two, even though they form one pair. The section on paired reads also includes information about paired distance and counts the number of pairs that were broken due to:
- Wrong distance: When starting the mapping, a distance interval is specified. If the reads during the mapping are placed outside this interval, they will be counted here.
- Mate inverted: If one of the reads has been matched as reverse complement, the pair will be broken (note that the pairwise orientation of the reads is determined during import).
- Mate on other contig: If the reads are placed on different contigs, the pair will also be broken.
- Mate not matched: If only one of the reads match, the pair will be broken as well.
Each subsection contains a table that recapitulates the read count, % of all mapped reads, mean read length and total read length, and for some sections two graphs showing the distribution of match specificity or the distribution of mismatches.
Note that for the section concerning paired reads (see figure 30.21), the distance includes both the read sequence and the insert between them as explained in General notes on handling paired data.
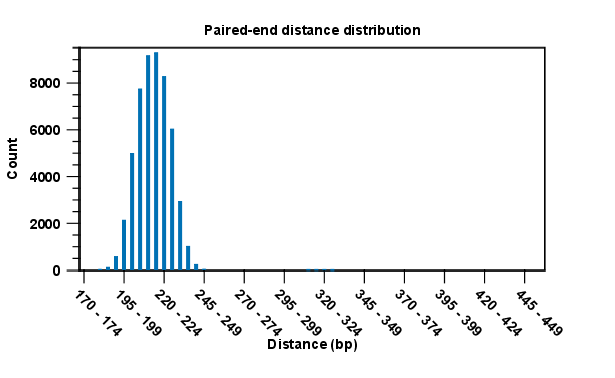
Figure 30.21: A bar plot showing the distribution of distances between intact pairs.
The following subsections give graphs showing read length distribution, insertion length distribution, deletion length distribution. Two plots of the distribution of insertion and deletion lengths can be seen in figure 30.22 and figure 30.23.
Nucleotide differences in reads relative to a reference gives the percentage of read bases that differ with the reference for all base pairs and a deletion. In the Nucleotide mapping section two tables give the counts and percentages of differences between the reads and the reference for each base. Graphs display the relative errors and errors counts between reads to reference and reference to reads, i.e., which bases in the reference are substituted to which bases in the reads. This information is plotted in different ways with an example shown here in figure 30.22.
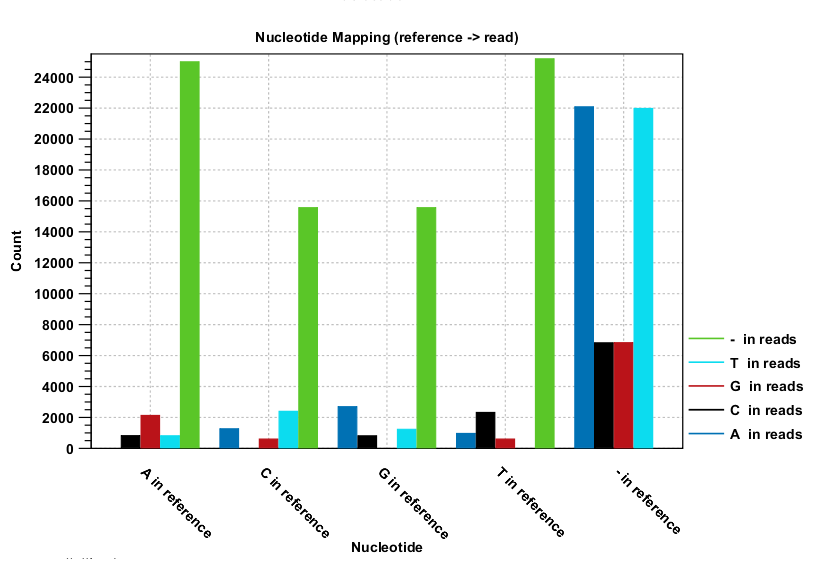
Figure 30.22: The As and Ts are more often substituted with a gap in the sequencing reads than C and G.
This example shows for each type of base in the reference sequence, which base (or gap) is found most often. Please note that only mismatches are plotted - the matches are not included. For example, an A in the reference is more often replaced by a G than any other base.
Below these plots, there are two plots of the quality values for matches and quality values for mismatches. Next, there is a plot of the mismatch fraction for each read position. Typically with quality dropping towards the end of a read, there will be more mismatches towards the end as the example in figure 30.23 shows.
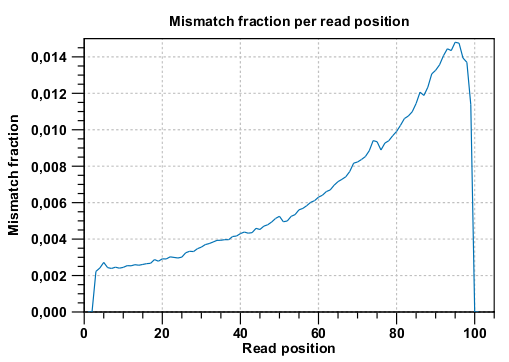
Figure 30.23: There are mismatches towards the end of the reads.
The last section provides information about unaligned ends.
The unaligned ends table contains the following information:
- Read count The number of reads with unaligned ends.
- Read count % of all mapped reads Percent of mapped reads that have an unaligned end.
- Positions covered The number of positions where an unaligned end starts. If multiple unaligned ends start at the same position, these are only counted once.
- Positions covered in % of reference Positions covered / positions in the reference * 100
- Positions covered in % of bases covered Positions covered / positions that have one or more mapped reads * 100
The table is followed by two plots providing the lengths of unaligned ends and their counts.