View settings in the Side Panel
Here we cover a few of the key settings available in the side panel for customizing how a contig or read mapping looks. We step through them according to the tab names in the side panel.
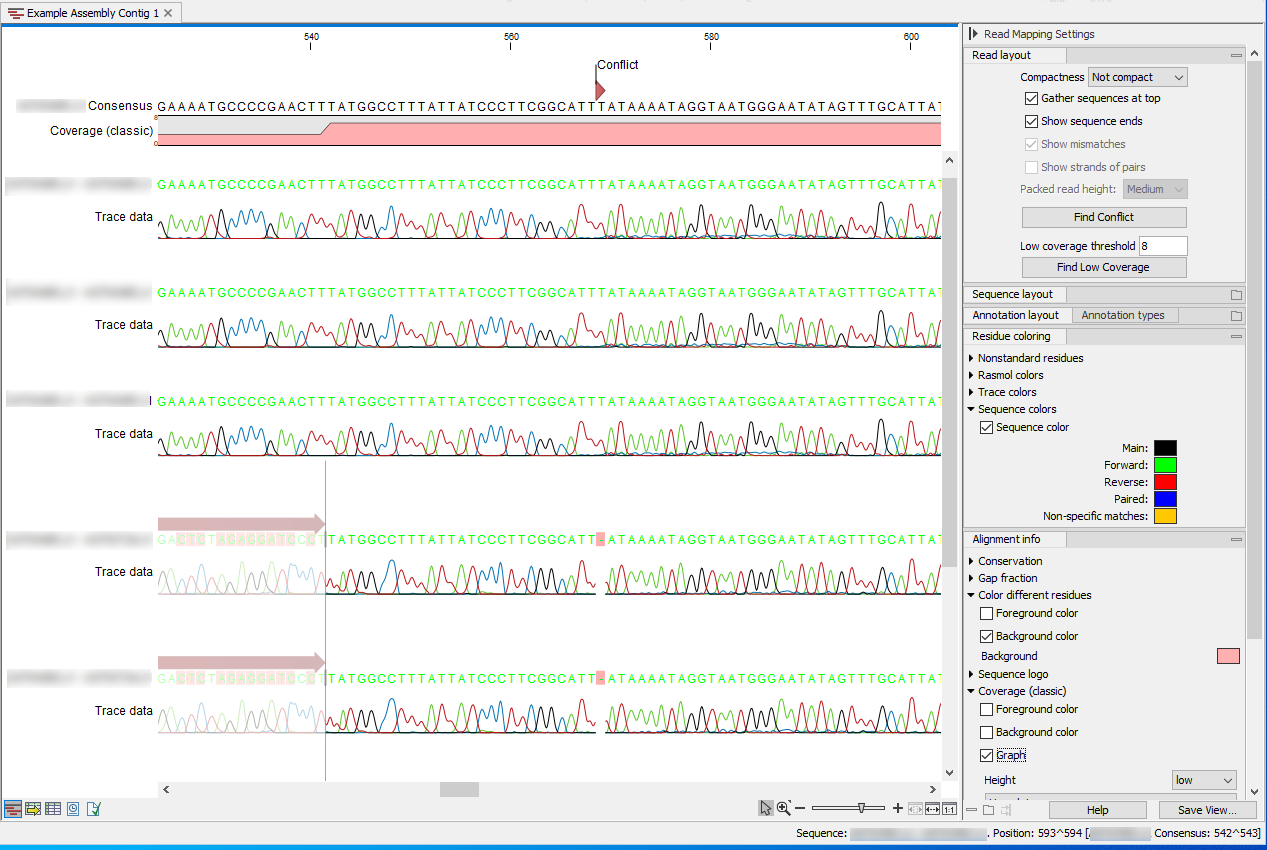
Figure 23.14: Settings in the side panel allow customization of the view of read mappings and contigs from assemblies.
- Read layout.
- Compactness. Set the level of detail to be displayed. The level of compactness affects other view settings as well as the overall view. For example:
if Compact is selected, quality scores and annotations on the reads will not be visible, even if these options are turned on under the "Nucleotide info" palette. Compactness can also be changed by pressing and holding the Alt key while scrolling with the mouse wheel or touchpad.
- Not compact. This allows the mapping to be viewed in full detail, including quality scores and trace data for the reads, where present. To view such information, additional viewing options under the Nucleotide info view settings must also selected. For further details on these, see Trace settings in the Side Panel and Nucleotide info.
- Low. Hides trace data, quality scores and puts the reads' annotations on the sequence. The editing functions available when right-clicking on a nucleotide with compactness set to Low is shown in figure 23.15.
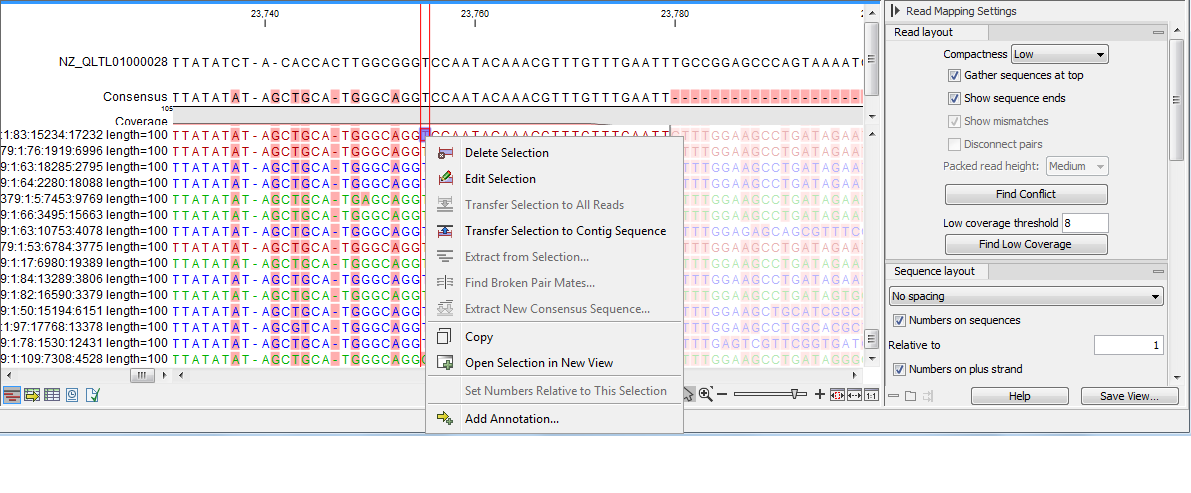
Figure 23.15: An example showing the low compactness setting. - Medium. The labels of the reads and their annotations are hidden, and reads are shown as lines. The residues of the reads cannot be seen, even when zoomed in 100%.
- Compact. Like Medium but with less space between the reads.
- Packed. This uses all the horizontal space available for displaying the reads (figure 23.16). This differs from the other settings, which stack all reads vertically. When zoomed in to 100%, the individual residues are visible. When zoomed out, reads are represented as lines. Packed mode is useful when viewing large amounts of data, but some functionality is not available. For example, the read mapping cannot be edited, portions cannot be selected, and color coding changes are not possible.
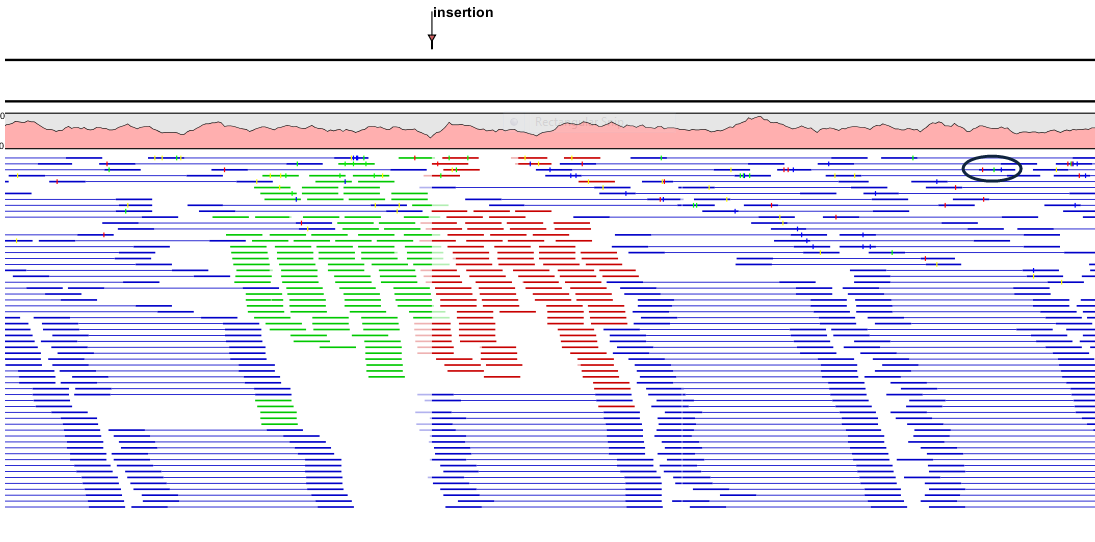
Figure 23.16: An example of the Packed compactness setting. Highlighted in black is an example of 3 narrow vertical lines representing mismatching residues.
- Gather sequences at top. When selected, the sequence reads contributing to the mapping at that position are placed right below the reference. This setting has no effect when the compactness level is Packed.
- Show sequence ends. When selected, trimmed regions are shown (faded traces and residues). Trimmed regions do not contribute to the mapping or contig.
- Show mismatches. When selected and when the compactness is set to Packed, based that do not match the reference at that position are highlighted by coloring them according to the Rasmol color scheme. Reads with mismatches are floated to the top of the view.
- Show strands of paired reads. When the compactness is set to Packed, display each member of a read pair in full and color them according to direction. This is particularly useful for reviewing overlap regions in overlapping read pairs.
Packed read height. When the compactness is set to "Packed", select a height for the visible reads.
When there are more reads than the height specified, a coverage graph is displayed that uses the same colors as the sequences. Mismatches in reads are shown as narrow vertical lines, using colors representing the mismatching residue. Horizontal line colors correspond to those used for highlighting mismatches in the sequences (red = A, blue = C, yellow = G, and green = T). For example, a red line with half the height of the blue part of the coverage graph represents a mismatching "A" in half of the paired reads at that particular position.
- Find Conflict. Clicking this button selects the next position where there is an conflict. Mismatching residues are colored using the default color settings. You can also click on the Space bar of your keyboard to find the next conflict.
- Low coverage threshold. All regions with coverage up to and including this value are considered low coverage. Clicking the 'Find low coverage' button selects the next region in the read mapping with low coverage.
- Compactness. Set the level of detail to be displayed. The level of compactness affects other view settings as well as the overall view. For example:
if Compact is selected, quality scores and annotations on the reads will not be visible, even if these options are turned on under the "Nucleotide info" palette. Compactness can also be changed by pressing and holding the Alt key while scrolling with the mouse wheel or touchpad.
- Sequence layout. There is one parameter in this section in addition to those described in Sequence Layout
- Matching residues as dots. When selected, matching residues are presented as dots instead of as letters.
- Annotation Layout and Annotation Types See Viewing annotations in sequence views.
- Residue coloring. There is one parameter in this section in addition to those described in Residue coloring.
- Sequence colors. This setting controls the coloring of sequences when working in most compactness modes. The exception is Packed mode, where colors are controlled with settings under the "Match coloring" tab, described below.
- Main. The color of the consensus and reference sequence. Black by default.
- Forward. The color of forward reads. Green by default.
- Reverse. The color of reverse reads. Red by default.
- Paired. The color of read pairs. Blue by default. Reads from broken pairs are colored according to their orientation (forward or reverse) or as a non-specific match, but with a darker hue than the color of ordinary reads.
- Non-specific matches. When a read would have matched equally well another place in the mapping, it is considered a non-specific match and is colored yellow by default. Coloring to indicate a non-specific match overrules other coloring. For mappings with several reference sequences, a read is considered a non-specific match if it matches more than once across all the contigs/references.
- Sequence colors. This setting controls the coloring of sequences when working in most compactness modes. The exception is Packed mode, where colors are controlled with settings under the "Match coloring" tab, described below.
- Alignment info. There are several parameters in this section in addition to the ones described in View alignments.
- Coverage: Shows how many reads are contributing information to a given position in the read mapping. The level of coverage is relative to the overall number of reads.
- Paired distance: Plots the distance between the members of paired reads.
- Single paired reads: Plots the percentage of reads marked as single paired reads (when only one of the reads in a pair matches).
- Non-specific matches: Plots the percentage of reads that also match other places.
- Non-perfect matches: Plots the percentage of reads that do not match perfectly.
- Spliced matches: Plots the percentage of reads that are spliced.
- Foreground color. Colors the residues using a gradient, where the left side color is used for low coverage and the right side is used for maximum coverage.
- Background color. Colors the background of the residues using a gradient, where the left side color is used for low coverage and the right side is used for maximum coverage.
- Graph. Read coverage is displayed as a graph. The data points for the graph can be exported (see Export graph data points to a file).
- Height. Specifies the height of the graph.
- Type. The graph can be displayed as Line plot, Bar plot or as a Color bar.
- Color box. For Line and Bar plots, the color of the plot can be set by clicking the color box. If a Color bar is chosen, the color box is replaced by a gradient color box as described under Foreground color.
- Nucleotide info See Nucleotide info
- Match coloring Coloring of the mapped reads when the Packed compactness option is selected. Colors can be adjusted by clicking on an individual color and selecting from the palette presented. Coloring of bases when other compactness settings are selected is controlled under the "Residue coloring" tab.
- Find See Find
- Text format See Text format