Learn Peak Shape Filter
The Learn Peak Shape Filter tool allows you to build a new peak shape filter from sequencing data and a set of positive and negative regions. The resulting filter can be used to identify genomic regions whose read coverage profile matches the characteristic shape of the positive examples and does not match the shape of the negative examples. See Learning peak shapes for the procedure used to build the peak shape filter.
An example of such filter is shown in figure 36.30.
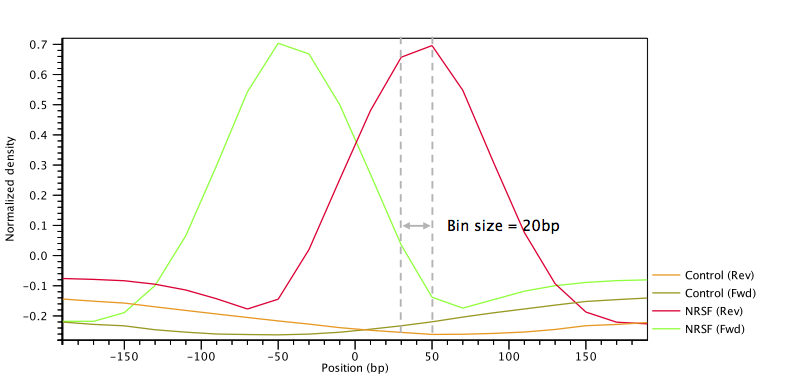
Figure 36.30: Example of a peak shape filter with a window size of 400bp made up of 20 bins of size 20bp each. The filter was built from ChIP-Seq data of the transcription factor NRFS and a control ChIP-Seq experiment.
To run the Learn Peak Shape Filter tool:
Tools | Epigenomics Analysis (![]() ) | Advanced Peak Shape Tools (
) | Advanced Peak Shape Tools (![]() ) | Learn Peak Shape Filter (
) | Learn Peak Shape Filter (![]() )
)
This will open up the wizard shown in figure 36.31 where
you can select the input data (for example the mapped ChIP-Seq reads). Track based read
mappings (![]() ) and stand-alone read mappings (
) and stand-alone read mappings (![]() ) /
(
) /
(![]() ) are both accepted. Multiple inputs are
accepted, provided that they refer to the same genome.
) are both accepted. Multiple inputs are
accepted, provided that they refer to the same genome.
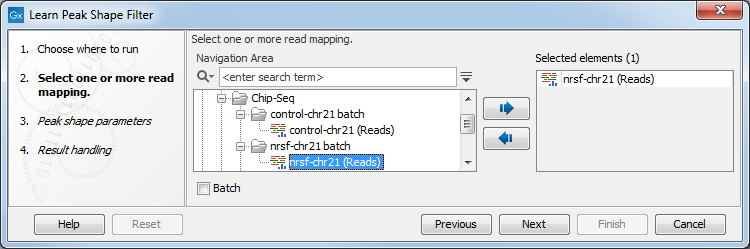
Figure 36.31: Select the input data for the Learn Peak Shape Filter tool.
Click Next to go to the next wizard step (shown in figure 36.32).
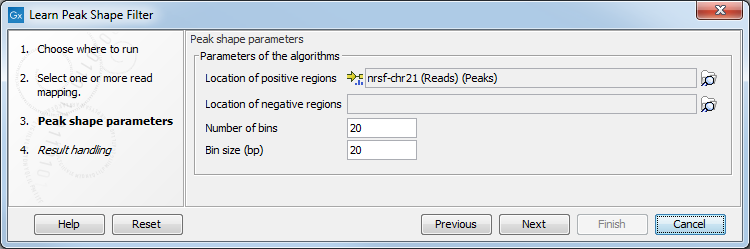
Figure 36.32: Options for Learn Peak Shape Filter.
In this wizard step you have the following options:
- Location of positive regions An annotation
track (
 ) containing the location of the positive regions (e.g.
ChIP-Seq peaks) that will be used to build the peak shape filter. The set of positive regions should include examples where the shape is clearly exhibited. It is preferable to have fewer peaks with high quality rather than a large amount of ambiguous peaks. Typically, a number of positive peaks greater than 5-10 times the number of bins is sufficient to learn a well-defined shape.
) containing the location of the positive regions (e.g.
ChIP-Seq peaks) that will be used to build the peak shape filter. The set of positive regions should include examples where the shape is clearly exhibited. It is preferable to have fewer peaks with high quality rather than a large amount of ambiguous peaks. Typically, a number of positive peaks greater than 5-10 times the number of bins is sufficient to learn a well-defined shape.
- Location of negative regions An annotation track
() containing the location of the negative regions that will be used to build the peak shape filter (e.g.
background, PCR artifacts or examples of bad peaks from a previous run of the ChIP-Seq analysis tool). If no annotation track is provided, a negative profile will be derived from sequencing
noise.
- Number of bins The number of bins to use to build the filter. The default value of
 for the Number of bins parameter should be satisfactory for most uses. Higher values may be useful when the shape to be learned is particularly complex. Note that if the chosen number of bins is very large, the learned peak shape filter may not be smooth and could over-fit the input data. If only few positive regions are available, reducing the number of bins may be helpful.
- Bin size The size of each bin in base pairs. The bin size is related to the window size (i.e. the length of the shape to be learned) by the formula
 (see figure 36.30).
The result of the algorithm will be a Peak shape filter (![]() ), which can then be applied to call peaks or score regions
using Apply Peak Shape Filter.
After clicking on the button labeled Next, you can choose whether you want
to open the result directly, or save the results in the Navigation Area.
If you choose to save the results, you will be asked to specify where you would
like to save them.
), which can then be applied to call peaks or score regions
using Apply Peak Shape Filter.
After clicking on the button labeled Next, you can choose whether you want
to open the result directly, or save the results in the Navigation Area.
If you choose to save the results, you will be asked to specify where you would
like to save them.