Primer design - an introduction
Primer design can be accessed in two ways:
Tools | Molecular Biology Tools (![]() ) | Primers and Probes (
) | Primers and Probes (![]() )| Design Primers (
)| Design Primers (![]() ) | OK
) | OK
or right-click sequence in Navigation Area | Show | Primer Designer (![]() )
)
In the primer view (see figure 22.1), the basic options for viewing the template sequence are the same as for the standard sequence view (see Working with sequences for an explanation of these options). This means that annotations such as known SNPs or exons can be displayed on the template sequence to guide the choice of primer regions. In addition, traces in sequencing reads can be shown along with the structure to guide the re-sequencing of poorly resolved regions.
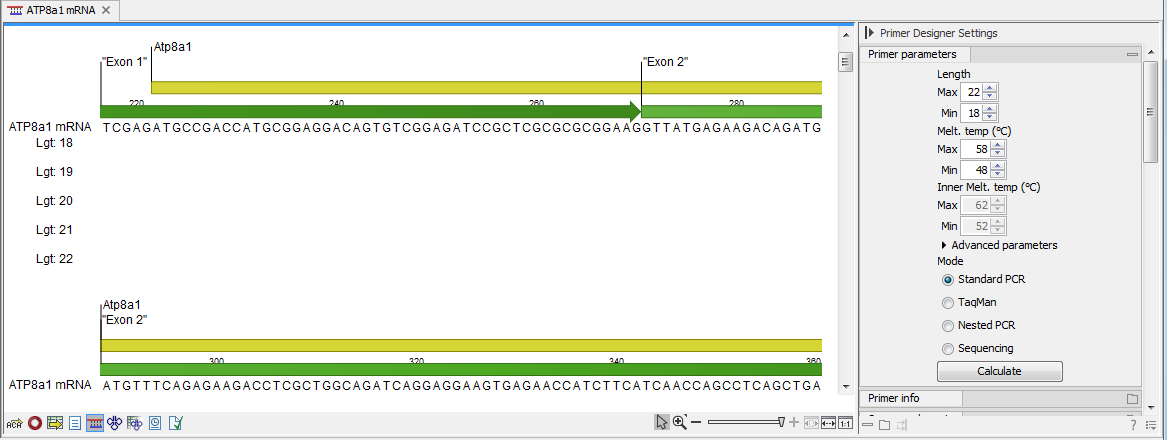
Figure 22.1: The initial view of the sequence used for primer design.
General concept
The concept of the primer view is that the user first chooses the desired reaction type for the session in the Primer Parameters preference group, e.g. Standard PCR. Reflecting the choice of reaction type, it is now possibly to select one or more regions on the sequence and to use the right-click mouse menu to designate these as primer or probe regions (see figure 22.2).
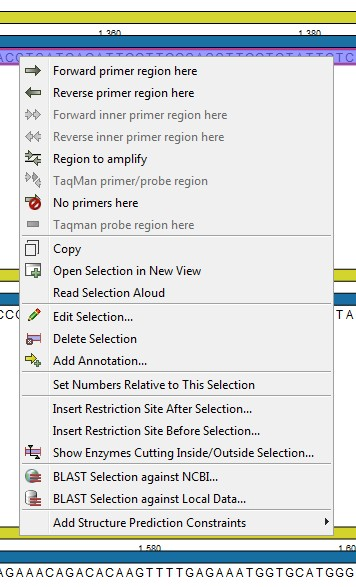
Figure 22.2: Right-click menu allowing you to specify regions for the primer design
When a region is chosen, graphical information about the properties of all possible primers in this region will appear in lines beneath it. By default, information is showed using a compact mode but the user can change to a more detailed mode in the Primer information preference group.
The number of information lines reflects the chosen length interval for primers and probes. In the compact information mode one line is shown for every possible primer-length and each of these lines contain information regarding all possible primers of the given length. At each potential primer starting position, a circular information point is shown which indicates whether the primer fulfills the requirements set in the primer parameters preference group. A green circle indicates a primer which fulfils all criteria and a red circle indicates a primer which fails to meet one or more of the set criteria. For more detailed information, place the mouse cursor over the circle representing the primer of interest. A tool-tip will then appear on screen, displaying detailed information about the primer in relation to the set criteria. To locate the primer on the sequence, simply left-click the circle using the mouse.
The various primer parameters can now be varied to explore their effect and the view area will dynamically update to reflect this allowing for a high degree of interactivity in the primer design process.
After having explored the potential primers the user may have found a satisfactory primer and choose to export this directly from the view area using a mouse right-click on the primers information point. This does not allow for any design information to enter concerning the properties of primer/probe pairs or sets e.g. primer pair annealing and ![]() difference between primers. If the latter is desired the user can use the Calculate button at the bottom of the Primer parameter preference group. This will activate a dialog, the contents of which depends on the chosen mode. Here, the user can set primer-pair specific setting such as allowed or desired
difference between primers. If the latter is desired the user can use the Calculate button at the bottom of the Primer parameter preference group. This will activate a dialog, the contents of which depends on the chosen mode. Here, the user can set primer-pair specific setting such as allowed or desired ![]() difference and view the single-primer parameters which were chosen in the Primer parameters preference group.
difference and view the single-primer parameters which were chosen in the Primer parameters preference group.
Upon pressing finish, an algorithm will generate all possible primer sets and rank these based on their characteristics and the chosen parameters. A list will appear displaying the 100 most high scoring sets and information pertaining to these. The search result can be saved to the navigator. From the result table, suggested primers or primer/probe sets can be explored since clicking an entry in the table will highlight the associated primers and probes on the sequence. It is also possible to save individual primers or sets from the table through the mouse right-click menu. For a given primer pair, the amplified PCR fragment can also be opened or saved using the mouse right-click menu.
Scoring primers
CLC Genomics Workbench employs a proprietary algorithm to rank primer and probe solutions. The algorithm considers both the parameters pertaining to single oligos, such as e.g. the secondary structure score and parameters pertaining to oligo-pairs such as e.g. the oligo pair-annealing score. The ideal score for a solution is 100 and solutions are thus ranked in descending order. Each parameter is assigned an ideal value and a tolerance. Consider for example oligo self-annealing, here the ideal value of the annealing score is 0 and the tolerance corresponds to the maximum value specified in the side panel. The contribution to the final score is determined by how much the parameter deviates from the ideal value and is scaled by the specified tolerance. Hence, a large deviation from the ideal and a small tolerance will give a large deduction in the final score and a small deviation from the ideal and a high tolerance will give a small deduction in the final score.