Bioinformatics explained: Protein statistics
Every protein holds specific and individual features which are unique to that particular protein. Features such as isoelectric point or amino acid composition can reveal important information of a novel protein. Many of the features described below are calculated in a simple way.
- Molecular weight
- The molecular weight is the mass of a protein or molecule. The molecular weight is simply calculated as the sum of the atomic mass of all the atoms in the molecule.
The weight of a protein is usually represented in Daltons (Da).
A calculation of the molecular weight of a protein does not usually include additional post-translational modifications. For native and unknown proteins it tends to be difficult to assess whether posttranslational modifications such as glycosylations are present on the protein, making a calculation based solely on the amino acid sequence inaccurate. The molecular weight can be determined very accurately by mass-spectrometry in a laboratory.
- Isoelectric point
- The isoelectric point (pI) of a protein is the pH where the proteins has no net charge. The pI is calculated from the pKa values for 20 different amino acids. At a pH below the pI, the protein carries a positive charge, whereas if the pH is above pI the proteins carry a negative charge. In other words, pI is high for basic proteins and low for acidic proteins. This information can be used in the laboratory when running electrophoretic gels. Here the proteins can be separated, based on their isoelectric point.
- Aliphatic index
- The aliphatic index of a protein is a measure of the relative volume occupied by aliphatic side chain of the following amino acids: alanine, valine, leucine and isoleucine. An increase in the aliphatic index increases the thermostability of globular proteins. The index is calculated by the following formula.

X(Ala), X(Val), X(Ile) and X(Leu) are the amino acid compositional fractions. The constants a and b are the relative volume of valine (a=2.9) and leucine/isoleucine (b=3.9) side chains compared to the side chain of alanine [Ikai, 1980].
- Estimated half-life
- The half life of a protein is the time it takes for the protein pool of that particular protein to be reduced to the half. The half life of proteins is highly dependent on the presence of the N-terminal amino acid, thus overall protein stability [Bachmair et al., 1986,Gonda et al., 1989,Tobias et al., 1991]. The importance of the N-terminal residues is generally known as the 'N-end rule'. The N-end rule and consequently the N-terminal amino acid, simply determines the half-life of proteins. The estimated half-life of proteins have been investigated in mammals, yeast and E. coli (table 19.2). If leucine is found N-terminally in mammalian proteins the estimated half-life is 5.5 hours.
Table 19.2: Estimated half life. Half life of proteins where the N-terminal residue is listed in the first column and the half-life in the subsequent columns for mammals, yeast and E. coli. 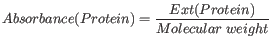
- Extinction coefficient
-
This measure indicates how much light is absorbed by a protein at a particular wavelength. The extinction coefficient is measured by UV spectrophotometry, but can also be calculated. The amino acid composition is important when calculating the extinction coefficient. The extinction coefficient is calculated from the absorbance of cysteine, tyrosine and tryptophan.
Two values are reported. The first value, "Non-reduced cysteines", is computed assuming that all cysteine residues appear as half cystines, meaning they form di-sulfide bridges to other cysteines:

The second value, "Reduced cysteines", assumes that no di-sulfide bonds are formed:

The extinction coefficient values of the three important amino acids at different wavelengths are found in [Gill and von Hippel, 1989] or in [Pace et al., 1995]. At 280nm the extinction coefficients are
- [Gill and von Hippel, 1989]: Ext(Cystine) = 120, Ext(Tyr) = 1280 and Ext(Trp) = 5690
- [Pace et al., 1995]: Ext(Cystine) = 125, Ext(Tyr) = 1490 and Ext(Trp) = 5500
This equation is only valid under the following conditions:
- pH 6.5
- 6.0 M guanidium hydrochloride
- 0.02 M phosphate buffer
Knowing the extinction coefficient, the absorbance (optical density) can be calculated using the following formula:

- Atomic composition
-
Amino acids are indeed very simple compounds. All 20 amino acids consist of combinations of only five different atoms. The atoms which can be found in these simple structures are: Carbon, Nitrogen, Hydrogen, Sulfur, Oxygen. The atomic composition of a protein can for example be used to calculate the precise molecular weight of the entire protein.
- Total number of negatively charged residues (Asp + Glu)
-
At neutral pH, the fraction of negatively charged residues provides information about the location of the protein. Intracellular proteins tend to have a higher fraction of negatively charged residues than extracellular proteins.
- Total number of positively charged residues (Arg + Lys)
-
At neutral pH, nuclear proteins have a high relative percentage of positively charged amino acids. Nuclear proteins often bind to the negatively charged DNA, which may regulate gene expression or help to fold the DNA. Nuclear proteins often have a low percentage of aromatic residues [Andrade et al., 1998].
- Amino acid distribution
-
Amino acids are the basic components of proteins. The amino acid distribution in a protein is simply the percentage of the different amino acids represented in a particular protein of interest. Amino acid composition is generally conserved through family-classes in different organisms which can be useful when studying a particular protein or enzymes across species borders. Another interesting observation is that amino acid composition variate slightly between proteins from different subcellular localizations. This fact has been used in several computational methods, used for prediction of subcellular localization.
- Annotation table
-
This table provides an overview of all the different annotations associated with the sequence and their incidence.
- Dipeptide distribution
- This measure is simply a count, or frequency, of all the observed adjacent pairs of amino acids (dipeptides) found in the protein. It is only possible to report neighboring amino acids. Knowledge on dipeptide composition have previously been used for prediction of subcellular localization.