Differences in the variants called by the different tools
Because the tools differ in their underlying assumptions about the data, different variants may be called on the same data set using the same filter settings (see Filters). In general,
- the Basic Variant Detection tool calls the highest number of variants. It runs relatively quickly because it does not do any error-model estimation.
- the Low Frequency Variant Detection tool calls only a subset of the variants called by the Basic Variant Detection tool. The variants called by the Basic Variant Detection tool but not called by the Low Frequency Variant Detection tool usually originate from sequencing errors. The Low Frequency Variant Detection tool is the slowest of the three variant callers as it estimates an error-model and does not just consider variants within a specified ploidy model.
- the Fixed Ploidy Variant Detection tool calls a subset of the variants called by the Low Frequency Variant Detection tool. The variants called by the Low Frequency Variant Detection tool but not called by the Fixed Ploidy Variant Detection tool likely originate from mapping or sequencing errors.
The following examples show a Track list view of the variants detected by the three different variant detection tools for a particular data set with the same the filter settings. The top three variant tracks contain the results of the variant detection tools. The numbers of variants called are shown on the left side in brackets under the variant track names. The track 'basicV2' contains the results of the Basic Variant Detection tool, the track 'LowFreq' contains the results of the Low Frequencey Variant Detection tool and the track 'FixedV2' contains the results of the Fixed Ploidy Variant detection tool. The other variant tracks display comparisons between results of the different tools. The particular comparisons is described in the name of each of these tracks.
Figure 32.2 highlights a variant reported by the Basic Variant Detection tool but not by the other variant detection tools. The information in the table view of the Basic Variant Detection results track ('basicV2') reveals that the variant is present at a low frequency (3 reads) in a high coverage position (209 reads), suggesting that is not a true variant but rather a sequencing error.
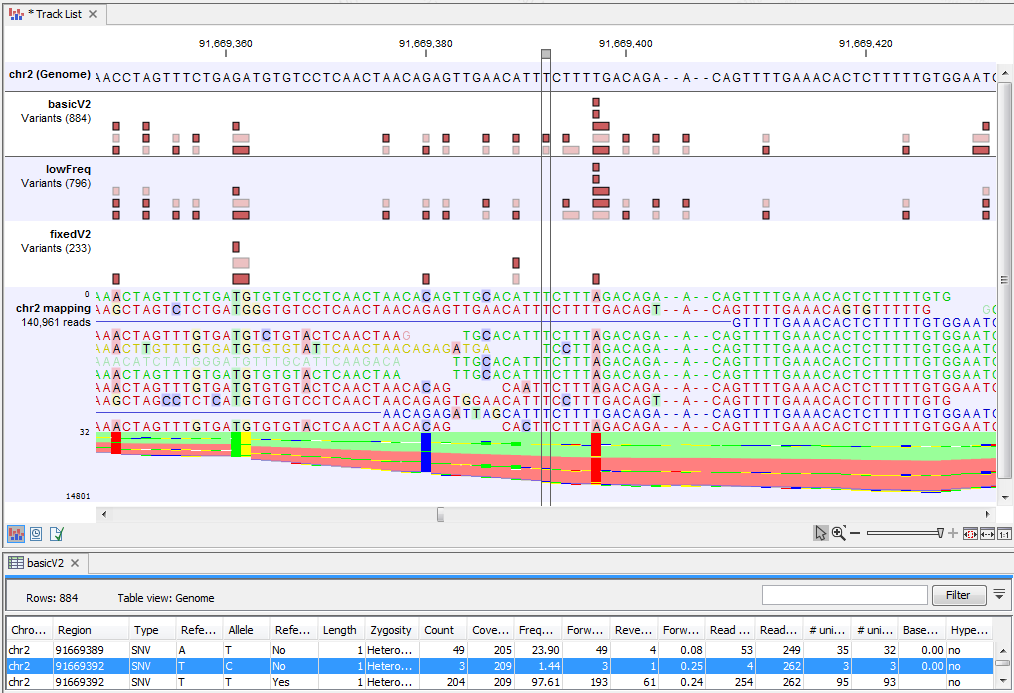
Figure 32.2: Case where a variant is detected only using the Basic Variant Detection tool.
Figure 32.3 shows variant calls produced by the three variant detection tool with the same data and general filter settings. As expected, the Basic Variant Detection tool reports the most variants (884), the Fixed Ploidy reports the fewest (233), and the Low Frequency Variant Detection tool detects a number between these two (796). But note that in the track named 'inLowFreqV2-notInBasicV2' that there are 9 variants reported by the Low Frequency Variant Detection tool that are not reported by the Basic Variant detection tool. It is because these variants are considered as several SNVs by the Low Frequency Variant Detection tool when they were part of a more complex MNV in the Basic Variant Detection results. In the case of the variant highlighted in figure 32.3, the Low Frequency Variant Detection calls for one variant in results track ('lowFreq'), while the Basic Variant Detection called a heterozygous 2 bp MNV in results track ('basicV2'). Here, the Low Frequency Variant Detection tool called only one of the two SNVs of that MNV. The second SNV of the MNV was not deemed to be supported by the evidence in the data when error modelling was carried out and so was not reported.
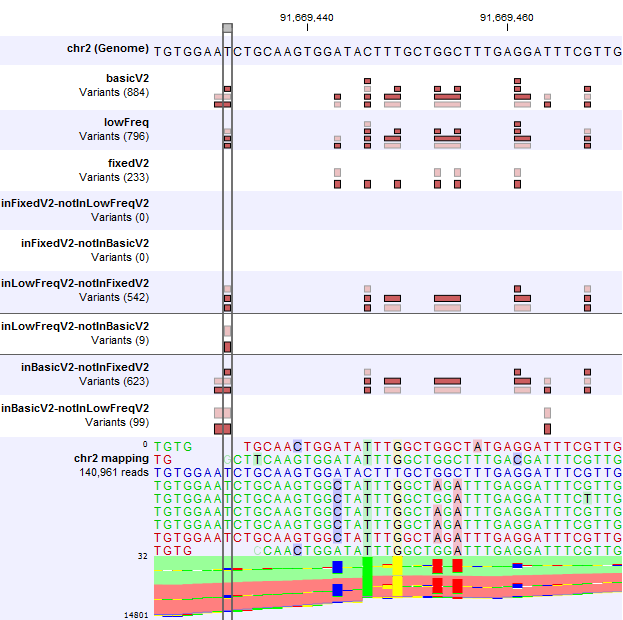
Figure 32.3: Case where variants can be detected as SNV by a tool and MNV by another.
Figure 32.4 shows a variant that is detected by both the Basic and the Low Frequency Variant Detection tools, but not by the Fixed Ploidy Variant Detection tool when a ploidy of 2 was specified. The information in the table view of the Low Frequency Variant Detection results track ('lowFreq') reveals that the highlighted variant is present in 29 reads in an area with coverage 204, a ratio inconsistent with what can be expected from a diploid sample, thus preventing the stringent Fixed Ploidy Variant Detection tool to call it as a variant. It is also unlikely that this variant was caused by sequencing error. The most likely explanation for the presence of this variant is that it originated from an error in the mapping of the reads. This happens if reads are mapped to a reference area that does not represent their true source, using for example an incomplete reference or one from a too distantly related organism.
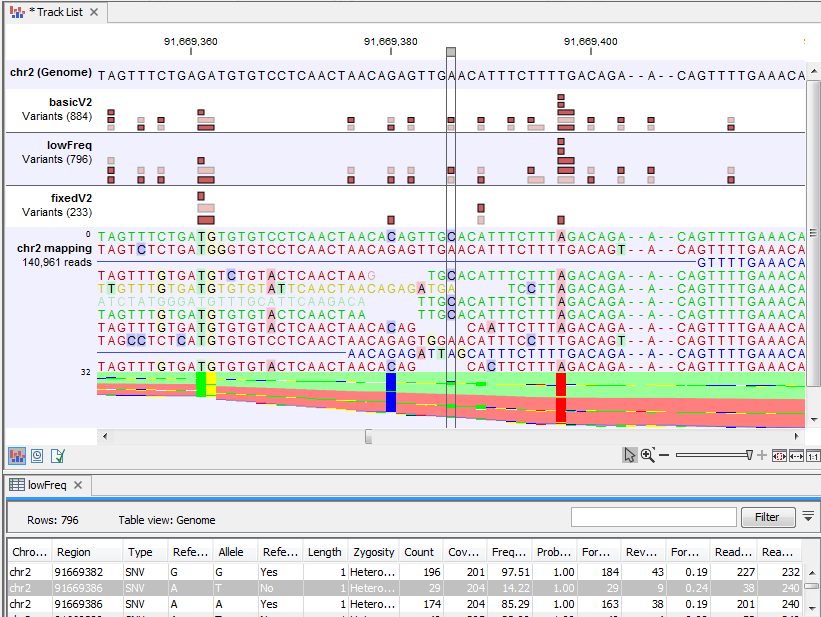
Figure 32.4: Case where a variant does not fit the ploidy assumption.