Create Mapping Graph
Create Mapping Graph creates graph tracks containing coverage or distance values derived from a read mapping.
To run the tool, go to:
Tools | Utility Tools (![]() ) | Tracks (
) | Tracks (![]() ) | Graph Tracks (
) | Graph Tracks (![]() ) | Create Mapping Graph (
) | Create Mapping Graph (![]() )
)
After specifying the read mapping track (aka "reads track") to use as input (figure 28.26), the values to generate graph tracks for are specified (figure 28.27). One graph track is created for each type selected.
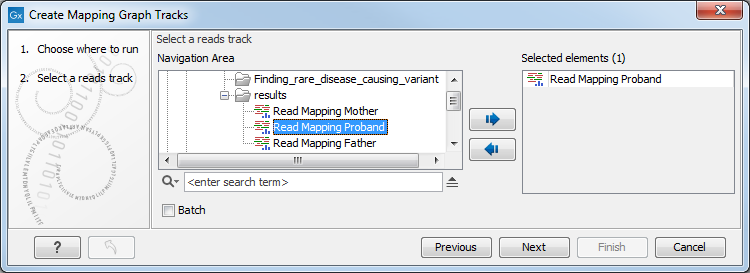
Figure 28.26: A read mapping track is selected as input to Create Mapping Graph.
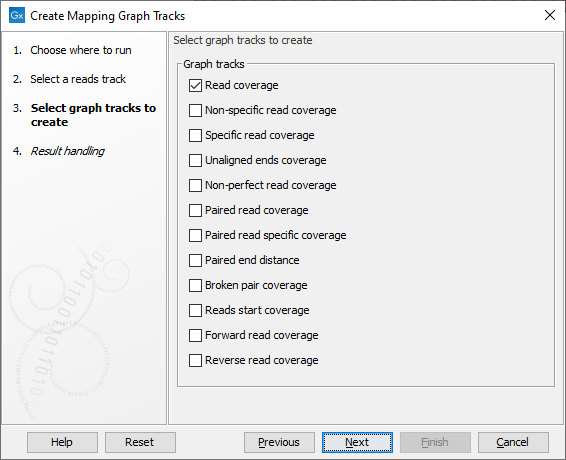
Figure 28.27: Choose the types of graph tracks to be created.
The value types are:
- Read coverage The number of reads contributing to the mapping at each position. See Reference sequence statistics for further details.
- Non-specific read coverage The number of reads mapped at the position that would map equally well to other places in the reference sequence.
- Specific read coverage The number of reads that map uniquely at the position, i.e. they do not map equally well to other places in the reference sequence.
- Unaligned ends coverage The number of reads with unaligned ends at the position. Unaligned ends arise when a read has been locally aligned and the there are mismatches or gaps relative to the reference sequence at the end of the read. Unaligned regions do not contribute to coverage in other graph track types.
- Non-perfect read coverage The number of reads at the position with one or more mismatches or gaps relative to the reference sequence.
- Paired read coverage The number of intact read pairs mapped to the position. Coverage is counted as one in positions where the reads of a pair overlap.
- Paired read specific coverage The number of intact paired reads that map uniquely at the position, i.e. they do not map equally well to other places in the reference sequence.
- Paired end distance The average distance between the forward and reverse reads of pairs mapped to the position.
- Broken pair coverage The number of broken paired reads mapped to the position. A pair is marked as broken if only one read in the pair matches the reference, if the reads map to different chromosomes, or if the distance or relative orientation between the reads is not within the expected values.
- Reads start coverage The number of reads with their start mapped to the position.
- Forward read coverage The number of reads mapping in forward direction. First and second read of a pair will be counted separately.
- Reverse read coverage The number of reads mapping in reverse direction. First and second read of a pair will be counted separately.
A Track List with three graph tracks containing different types of information from a single mapping is shown in figure 28.28. The view in that figure is zoomed out fully, so three overlapping plots are visible in each track. The highest of the three plots (darkest shade) shows the maximum values, the middle one (medium shade) shows the mean values, and the bottom one (lightest shade) shows the minimum values observed along the mapping.
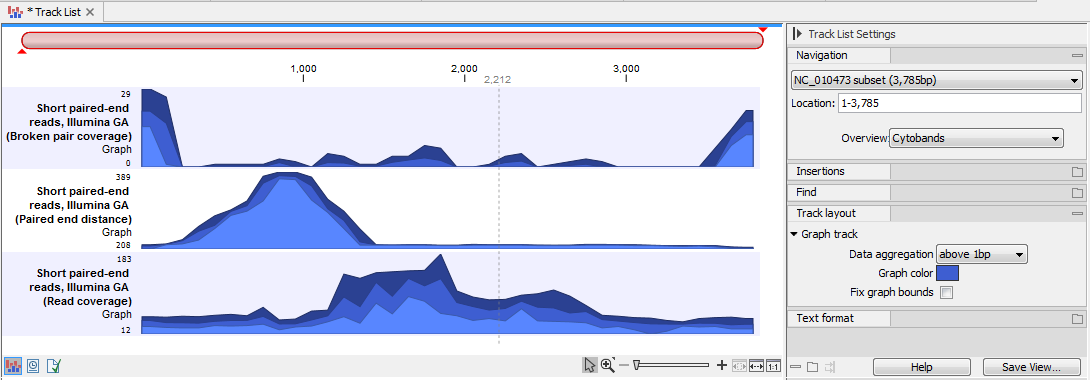
Figure 28.28: A Track List with three graph tracks containing different values from data in a single read mapping: broken pair coverage (top), paired end distance (middle) and read coverage (bottom). The view is fully zoomed out, so each track shows 3 overlapping plots. These show respectively, the highest, mean and lowest values along the mapping.
Hovering the mouse over a position reveals a tooltip showing the value at that position (figure 28.29).
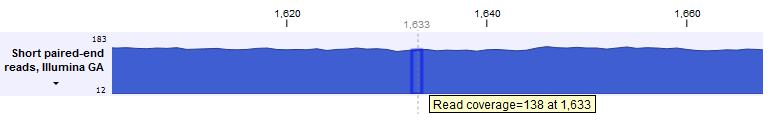
Figure 28.29: A graph track zoomed in to the single nucleotide level. The tooltip contains the value in that track at the position the mouse cursor is hovered over.
The y-axis values to display can be specified in the Track layout palette of the Side Panel. Check the "Fix graph bounds" to reveal fields where the value range can be entered. By default, the range displayed is 0 to the maximum value within that track. In the context of a Track List, this setting affects the y-axis values for all graph tracks in the list.