Create Feature Level Heat Map for RNA-Seq
Create Feature Level Heat Map for RNA-Seq takes at least two Expression tracks (![]() ) and creates a heat map that displays feature expression levels across these tracks. Each track represents a sample in the heat map. See The heat map view for details.
) and creates a heat map that displays feature expression levels across these tracks. Each track represents a sample in the heat map. See The heat map view for details.
To run the tool, go to:
Tools | RNA-Seq and Small RNA Analysis (![]() )| Expression Plots (
)| Expression Plots (![]() ) | Create Feature Level Heat Map for RNA-Seq (
) | Create Feature Level Heat Map for RNA-Seq (![]() )
)
The following options for performing hierarchical clustering for the samples and features (see Normalization and clustering) can be configured in the Distances dialog (figure 34.74):
- Distance measure for calculating distances between samples and features:
- Euclidean distance
- 1 - Pearson correlation
- Manhattan distance
- Cluster linkage for calculating distances between clusters:
- Single linkage
- Average linkage
- Complete linkage
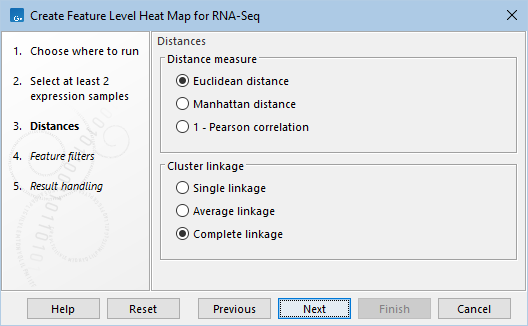
Figure 34.74: Distance options used to create the heat map.
Genomes often have too many features to visualize all of them meaningfully, and clustering such a large number is time-consuming. Therefore, it is recommended to reduce the number of features by configuring the options in the Feature filters dialog (figure 34.75):
- No filtering. All features are kept.
- Fixed number of features. A specified number of features are kept.
- Number of features. This number of features with the highest index of dispersion (variance to mean ratio) are kept. Raw count values (not normalized) are used to calculate this index.
- Minimum counts in at least one sample. Only features with at least this raw count value in one sample are kept.
- Filter features by statistics. Features that are differentially expressed according to the specified thresholds are kept.
- Statistical comparison. A Statistical Comparison Track (
 ), see Output of the Differential Expression tools.
- Minimum absolute fold change. Only features with at least this absolute fold change are kept.
- Threshold. Only features with at most this p-value are kept. The type of the p-value can be set to P-value, FDR p-value, or Bonferroni.
- Statistical comparison. A Statistical Comparison Track (
- Specify features. A set of specified features are kept.
- Feature track. An Annotation Track (
 ). All features in this track are kept.
- Feature names. Features with names in the list of case-sensitive names are kept. Any white-space characters, comma, and semicolon are accepted as separators.
- Feature track. An Annotation Track (
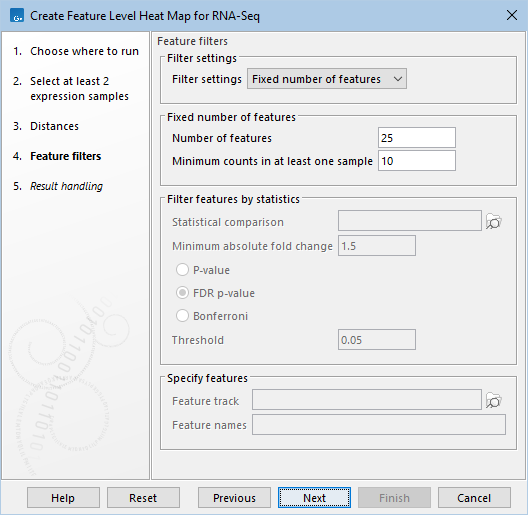
Figure 34.75: Feature filtering options.
Subsections