Differential Expression in Two Groups
The Differential Expression in Two Groups tool performs a statistical differential expression test for a set of Expression Tracks and a control. It uses multi-factorial statistics based on a negative binomial GLM as described in The statistical model. Differential Expression in Two Groups only handles one factor and two groups, as opposed to the Differential Expression for RNA-Seq tool that can handle multiple factors and multiple groups.
To run Differential Expression in Two Groups, go to:
Tools | RNA-Seq and Small RNA Analysis (![]() )| Differential Expression (
)| Differential Expression (![]() ) | Differential Expression in Two Groups (
) | Differential Expression in Two Groups (![]() )
)
In the first dialog (figure 34.82), select a number of Expression tracks (![]() ) (GE or TE) and click Next.
For Transcripts Expression Tracks (TE), the values used as input are "Total transcript reads".
For Gene Expression Tracks (GE), the values used depend on whether an eukaryotic or prokaryotic organism is analyzed, i.e., if the option "Genome annotated with Genes and transcripts" or "Genome annotated with Genes only" was used. For Eukaryotes the values are "Total Exon Reads", whereas for Prokaryotes the values are "Total Gene Reads".
) (GE or TE) and click Next.
For Transcripts Expression Tracks (TE), the values used as input are "Total transcript reads".
For Gene Expression Tracks (GE), the values used depend on whether an eukaryotic or prokaryotic organism is analyzed, i.e., if the option "Genome annotated with Genes and transcripts" or "Genome annotated with Genes only" was used. For Eukaryotes the values are "Total Exon Reads", whereas for Prokaryotes the values are "Total Gene Reads".
Note that the tool can be run in batch mode, albeit with the same control group expression for all selected batch units.
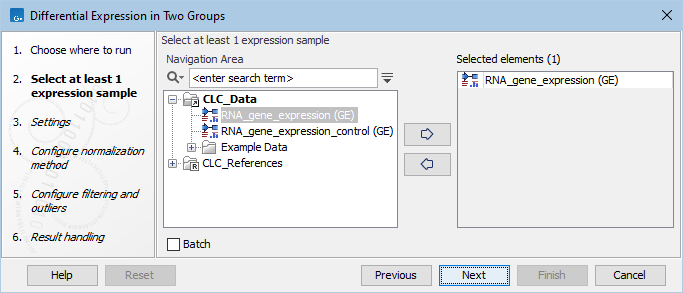
Figure 34.82: Select expression tracks for analysis.
In the Settings dialog, select a number of control Expression tracks (![]() ) (GE or TE). A warning message (as seen in figure 34.83) appears if only one track is selected for either the input or the control group: such a setting does not provide replicates, thus does not ensure sufficient statistical power to the analysis.
) (GE or TE). A warning message (as seen in figure 34.83) appears if only one track is selected for either the input or the control group: such a setting does not provide replicates, thus does not ensure sufficient statistical power to the analysis.
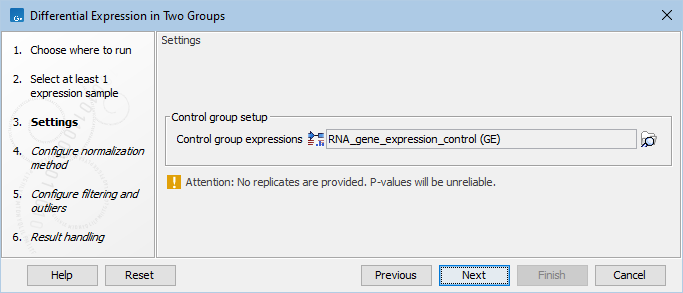
Figure 34.83: Select enough control expression tracks to ensure that replicates are provided.
The available normalization options can be seen in figure 34.84.
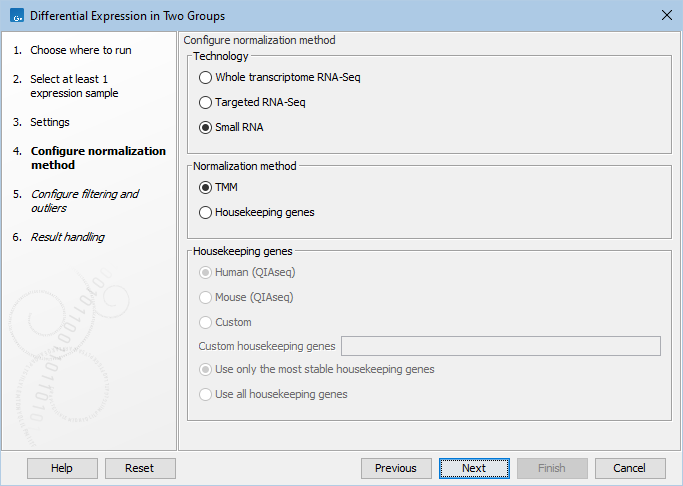
Figure 34.84: Normalization methods.
First, choose the application that was used to generate the expression tracks: Whole transcriptome RNA-Seq, Targeted RNA-Seq, or Small RNA. For Targeted RNA-Seq and Small RNA, you can choose between two normalization methods: TMM and Housekeeping genes, while Whole transcriptome RNA-Seq will be normalized by default using the TMM method. For more detail on the methods see TMM Normalization.
TMM Normalization (Trimmed Mean of M values) calculates effective libraries sizes, which are then used as part of the per-sample normalization. TMM normalization adjusts library sizes based on the assumption that most genes are not differentially expressed.
Normalization with Housekeeping genes can be done when a set of housekeeping genes to use is available: in the "Custom housekeeping genes" field, type the name of the genes separated by a space. Finally choose between these two options:
- Use only the most stable housekeeping genes will use a subset (at least three) of the most stable genes for normalization, these being defined using the GeNorm algorithm [Vandesompele et al., 2002].
- Use all housekeeping genes keep all housekeeping genes listed for normalization.
When working with Targeted RNA Panels, we recommend that normalization is done using the Housekeeping genes method rather than TMM. Predefined list of housekeeping genes are available for samples generated using Human and Mouse QIAseq panels (hover with the mouse on the dialog to find the list of genes included in the set). If you are working with a custom panel, you can also provide the corresponding set of housekeeping genes in the "Custom housekeeping genes" as described above.
In the final dialog, choose whether to downweight outlier expressions, and whether to filter on average expression prior to FDR correction.
Downweighting outliers is appropriate when a standard differential expression analysis is enriched for genes that are highly expressed in just one sample. These genes do not fit the null hypothesis of no change in expression across samples. Downweighting comes at a cost to precision and so is not recommended generally. For more details, see Downweighting outliers.
Filtering maximizes the number of results that are significant at a target FDR threshold, but at the cost of potentially removing significant results with low average expression. For more details, see Filtering on average expression.
The tool outputs a statistical comparison table, see Output of the Differential Expression tools.