Gene coverage
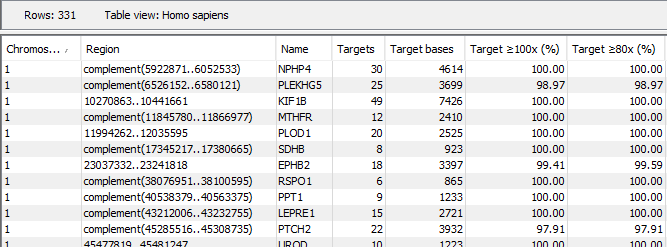
In the gene coverage track you can see coverage statistics for each
gene (figure 29.13). You can see the numbers by
going to the table (![]() ) view of the track.
) view of the track.
- Chromosome The name is taken from the reference sequence used for mapping.
- Region The gene region.
- Gene specific columns A number of columns from the Genes track used as input to QC for Targeted Sequencing. These can for example be name, source and gene_version.
- Targets The number of targets in the gene.
- Target bases The number of bases in the target regions in the gene.
- Target
 coverage (%) The percentage of bases in targets with coverage above the threshold.

Figure 29.13: An example of a gene coverage track.
