Bioinformatics explained: Dot plots
Dot plots are two-dimensional plots where the x-axis and y-axis each represents a sequence and the plot itself shows a comparison of these two sequences by a calculated score for each position of the sequence. If a window of fixed size on one sequence (one axis) match to the other sequence a dot is drawn at the plot. Dot plots are one of the oldest methods for comparing two sequences [Maizel and Lenk, 1981].
The scores that are drawn on the plot are affected by several issues.
- Scoring matrix for distance correction.
Scoring matrices (BLOSUM and PAM) contain substitution scores for every combination of two amino acids. Thus, these matrices can only be used for dot plots of protein sequences.
- Window size
The single residue comparison (bit by bit comparison(window size = 1)) in dot plots will undoubtedly result in a noisy background of the plot. You can imagine that there are many successes in the comparison if you only have four possible residues like in nucleotide sequences. Therefore you can set a window size which is smoothing the dot plot. Instead of comparing single residues it compares subsequences of length set as window size. The score is now calculated with respect to aligning the subsequences.
- Threshold
The dot plot shows the calculated scores with colored threshold. Hence you can better recognize the most important similarities.
Contrary to simple sequence alignments dot plots can be a very useful tool for spotting various evolutionary events which may have happened to the sequences of interest.
Below is shown some examples of dot plots where sequence insertions, low complexity regions, inverted repeats etc. can be identified visually.
Similar sequences
The most simple example of a dot plot is obtained by plotting two homologous sequences of interest. If very similar or identical sequences are plotted against each other a diagonal line will occur.
The dot plot in figure 19.6 shows two related sequences of the Influenza A virus nucleoproteins infecting ducks and chickens. Accession numbers from the two sequences are: DQ232610 and DQ023146. Both sequences can be retrieved directly from NCBI.
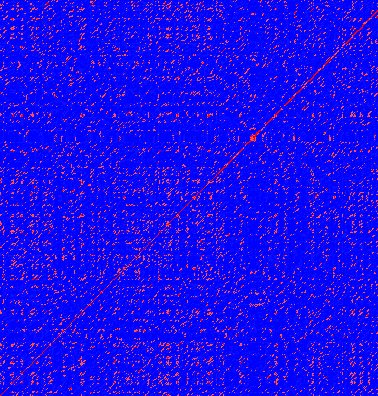
Figure 19.6: Dot plot of DQ232610 vs. DQ023146 (Influenza A virus nucleoproteins) showing and overall similarity.
Repeated regions
Sequence repeats can also be identified using dot plots. A repeat region will typically show up as lines parallel to the diagonal line.
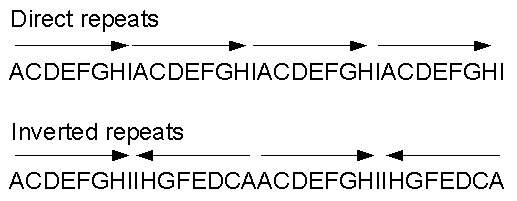
Figure 19.7: Direct and inverted repeats shown on an amino acid sequence generated for demonstration purposes.
If the dot plot shows more than one diagonal in the same region of a sequence, the regions depending to the other sequence are repeated. In figure 19.8 you can see a sequence with repeats.

Figure 19.8: The dot plot of a sequence showing repeated elements. See also figure 19.7.
Frame shifts
Frame shifts in a nucleotide sequence can occur due to insertions, deletions or mutations. Such frame shifts can be visualized in a dot plot as seen in figure 19.9. In this figure, three frame shifts for the sequence on the y-axis are found.
- Deletion of nucleotides
- Insertion of nucleotides
- Mutation (out of frame)
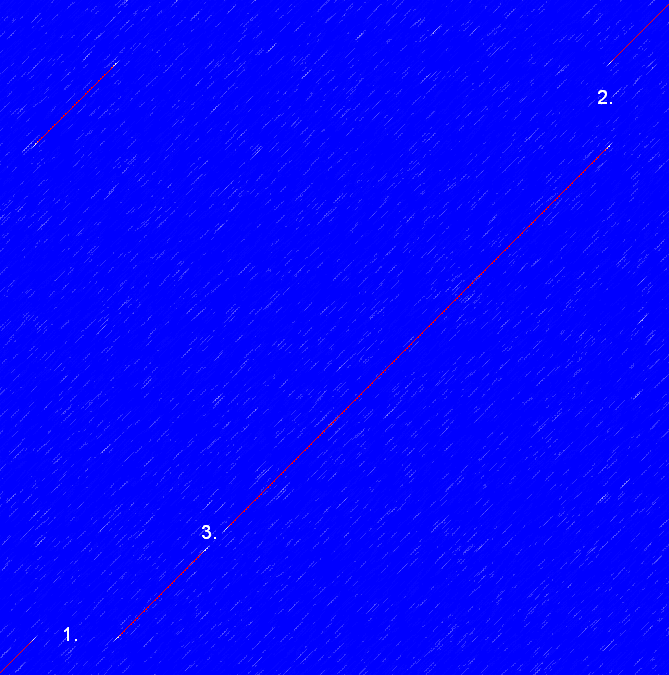
Figure 19.9: This dot plot show various frame shifts in the sequence. See text for details.
Sequence inversions
In dot plots you can see an inversion of sequence as contrary diagonal to the diagonal showing similarity. In figure 19.10 you can see a dot plot (window length is 3) with an inversion.
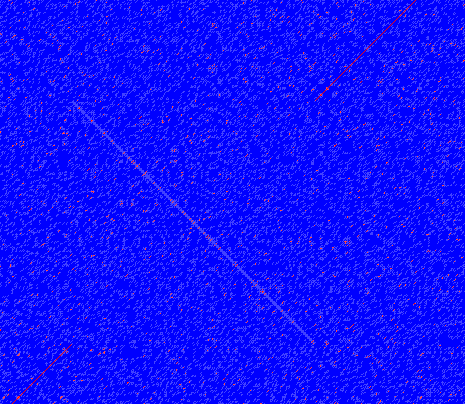
Figure 19.10: The dot plot showing an inversion in a sequence. See also figure 19.7.
Low-complexity regions
Low-complexity regions in sequences can be found as regions around the diagonal all obtaining a high score. Low complexity regions are calculated from the redundancy of amino acids within a limited region [Wootton and Federhen, 1993]. These are most often seen as short regions of only a few different amino acids. In the middle of figure 19.11 is a square shows the low-complexity region of this sequence.
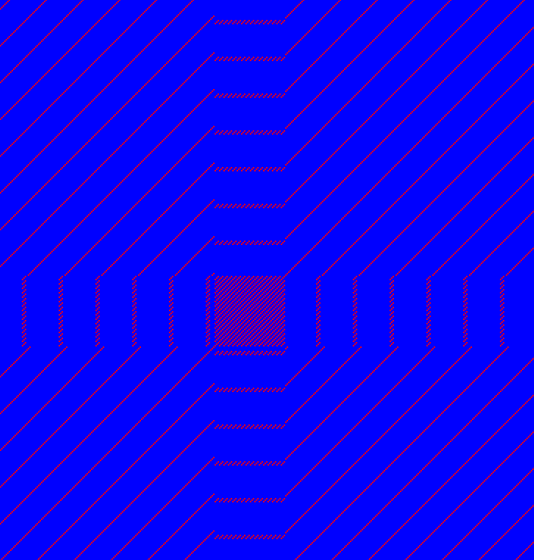
Figure 19.11: The dot plot showing a low-complexity region in the sequence. The sequence is artificial and low complexity regions do not always show as a square.