Scatter plot
An experiment can be viewed as a scatter plot (see Scatter plot view of an experiment).
You can also create a stand-alone scatter plot of two samples by going to:
Tools | Microarray Analysis (![]() )| General Plots (
)| General Plots (![]() ) | Create Scatter Plot (
) | Create Scatter Plot (![]() )
)
In the first wizard step, select the sample ( (![]() ), (
), (![]() ) or (
) or (![]() ) ) to be plotted on the X axis, and in the second wizard step, select the sample to be plotted on the Y axis.
) ) to be plotted on the X axis, and in the second wizard step, select the sample to be plotted on the Y axis.
In the following wizard step (figure 35.55), specify the values types to plot (see Selecting transformed and normalized values for analysis).
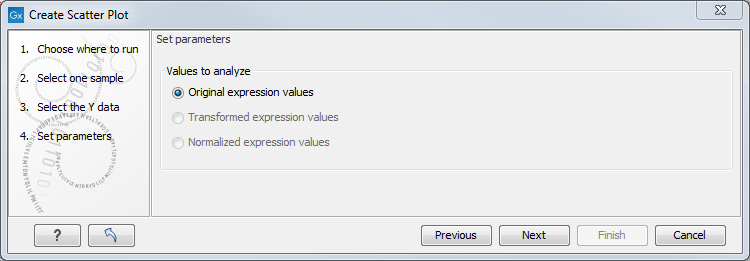
Figure 35.55: Selecting which values the scatter plot should be based on.
Click on Finish to launch the analysis.
For more information about the scatter plot view and how to interpret it, see Scatter plot view of an experiment.