Variant tracks
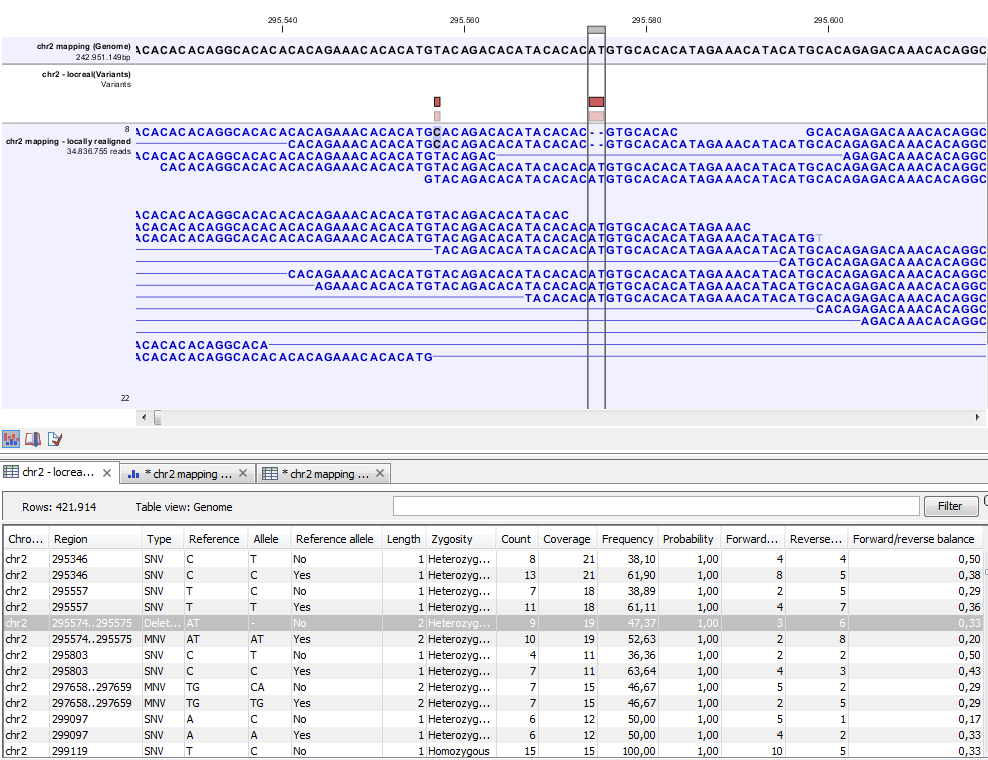
Figure 32.16: Variant track. The figure shows a track list (top), consisting of a reference sequence track, a variant track and a read mapping. The variant track was produced by running the Fixed Ploidy Variant Detection tool on the reads track. The variant track has been opened in a separate table view by double-clicking on it in the track list. By selecting a row in the variant track table, the track list view is centered on the corresponding variant.
A variant track (figure 32.16) usually contains the following information for each variant:
- Chromosome
- The name of the reference sequence on which the variant is located.
- Region
- The region on the reference sequence at which the variant is located. The region may be either a 'single position', a 'region' or a 'between position region'. Examples are given in figure 32.17.
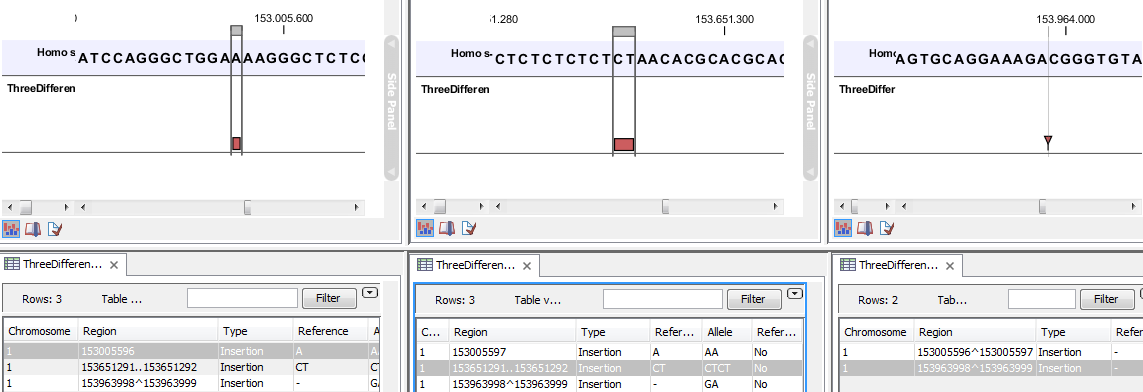
Figure 32.17: Examples of variants with different types of 'Region' column contents. The left-most variant has a 'single position' region, the middle variant has a 'region' region and the right-most has a 'between positions' region. - Type
- Variants are classified into five different types:
- SNV. A single nucleotide variant. This means that one base is replaced by one other base. This is also often referred to as a SNP. SNV is preferred over SNP because the latter includes an extra layer of interpretation about variants in a population. This means that an SNV could potentially be a SNP but this cannot be determined at the point where the variant is detected in a single sample.
- MNV. This type represents two or more SNVs in succession.
- Insertion. This refers to the event where one or more bases are inserted in the experimental data compared to the reference.
- Deletion. This refers to the event where one or more bases are deleted from the experimental data compared to the reference.
- Replacement. This is a more complex event where one or more bases have been replaced by one or more bases, where the identified allele has a length different from the reference (i.e., involving an insertion or deletion). Basically, this type represents variants that cannot be represented in the other four categories. An example could be
AAA->CC. This cannot be resolved into a SNV or an MNV because the number of bases is different between the experimental data and the reference, it is not an insertion because something is also deleted from the reference, and it is not a deletion because something is also inserted.
Note about overlapping variants: If two different types of variants occur in the same location, these are reported separately in the output table. This is particularly important when SNPs occur in the same position as an MNV. Usually, multiple SNVs occurring alongside each other would simply be reported as one MNV, but if one SNV of the MNV is found in additional case samples by itself, it will be reported separately. For example, if an MNV of AAT -> GCA at position 1 occurs in five of the case samples, and the SNV at position 1 of A -> G occurs in an additional 3 samples (so 8 samples in total), the output table will list the MNV and SNV information separately. However, the SNV will be shown as being present in only 3 samples, as this is the number in which it appears "alone".
- Reference
- The reference sequence at the position of the variant.
- Allele
- The allele sequence of the variant.
- Reference allele
- Describes whether the variant is identical to the reference. This will be the case one of the alleles for most, but not all, detected heterozygous variants (e.g. the variant detection tool might detect two variants, A and G, at a given position in which the reference is 'A'. In this case the variant corresponding to allele 'A' will have 'Yes' in the 'reference allele' column entry, and the variant corresponding to allele 'G' would have 'No'. Had the variant detection tool called the two variants 'C' and 'G' at the position, both would have had 'No' in the 'Reference allele' column).
- Length
- The length of the variant. The length is 1 for SNVs, and for MNVs it is the number of allele or reference bases (which will always be the same). For deletions, it is the length of the deleted sequence, and for insertions it is the length of the inserted sequence. For replacements, both the length of the replaced reference sequence and the length of the inserted sequence are considered, and the longest of those two is reported.
- Zygosity
- The zygosity of the variant called, as determined by the variant detection tool. This will be either 'Homozygous', where there is only one variant called at that position or 'Heterozygous' where more than one variant was called at that position.
- Count
- The number of 'countable' reads supporting the allele. The 'countable' reads are those that are used by the variant detection tool when calling the variant. Which reads are 'countable' depends on the user settings when the variant calling is performed - if e.g. the user has chosen 'Ignore broken pairs', reads belonging to broken pairs are not 'countable'. Note that, although overlapping paired reads have two reads in their overlap region, they only represent one fragment, and are counted only as one. (Please see the column 'Read count' below for a column that reports the value for 'reads' rather than for 'fragments'). Note also that the count value reported in the table may differ from the one accessible from the track's tooltip, as the 'count' value in the table is generated taking into account quality score and frequency of sequencing errors.
- Coverage
- The fragment coverage at this position. Only 'countable' fragments are considered (see under 'Count' above for an explanation of 'countable' fragments). Note that, although overlapping paired reads have two reads in their overlap region, they only represent one fragment, and overlapping paired reads contribute only 1 to the coverage. (Please see the column 'Read coverage' below for a column that reports the value for 'reads' rather than for 'fragments'). Also see Detailed information about overlapping paired reads for how overlapping paired reads are treated.)
- Frequency
- The number of 'countable' reads supporting the allele divided by the
number of 'countable' reads covering the position of the variant ('see under 'Count' above for an explanation of 'countable' reads).
- Forward
- and Reverse read count The number of 'countable' forward or reverse reads supporting the allele (see under 'Count' above for an explanation of 'countable' reads). Also see more information about Detailed information about overlapping paired reads.
- Forward
- and Reverse read coverage Coverage for forward or reverse reads supporting the allele.
- Forward/reverse balance
- The minimum of the fraction of 'countable' forward reads and 'countable' reverse reads carrying the variant among all 'countable' reads carrying the variant (see under 'Count' above for an explanation of 'countable' reads). Some systematic sequencing errors can be triggered by a certain combination of bases. This means that sequencing one strand may lead to sequencing errors that are not seen when sequencing the other strand. In order to evaluate whether the distribution of forward and reverse reads is approximately random, this value is calculated as the minimum of the number of forward reads divided by the total number of reads and the number of reverse reads divided by the total number of reads supporting the variant. An equal distribution of forward and reverse reads for a given allele would give a value of 0.5. (See also more information about Detailed information about overlapping paired reads.)
- Average quality
- The average base quality score of the bases supporting a variant. The average quality score is calculated by adding the Q scores of the nucleotides supporting the variant, and dividing this sum by the number of nucleotides supporting the variant. In the case of a deletion, the quality score reported is the lowest average quality of the two bases neighboring the deleted one. Similarly for insertions, the quality in reads where the insertion is absent is inferred from the lowest average of the two bases on either side of the position.
In rare cases, it can be possible that the quality score reported in this column for a deletion or insertion is below the threshold set for 'Minimum central quality', because this parameter is not applied to any quality value calculated from positions outside of the central variant.
If there are no values in this column, it is probably because the sequencing data was imported without quality scores (learn more about importing quality scores from different sequencing platforms in Import high-throughput sequencing data).
- Probability
- The contents of the Probability column (for Low Frequency and Fixed Ploidy Variant Detection tool only) depend on the variant detection tool that produced and the type of variant:
- In the Fixed Ploidy Variant Detection Tool, the probability in the resulting variant track's 'Probability' column is NOT the probability referred to in the wizard. The probability referred to in the wizard is the required minimum (posterior) probability that the site is NOT homozygous for the reference. The probability in the variant track 'Probability' column is the posterior probability of the particular site-type called. The fixed ploidy tool calculates the probability of the different possible configurations at each site. So using this tool, for single site variants the probability column just contains this quantity (for variants that span multiple positions see below).
- The Low Frequency Variant Detection tool makes statistical tests for the various possible explanations for each site. This means that the probability for the called variant must be estimated separately since it is not part of the actual variant calling. This is done by assigning prior probabilities to the various explanations for a site in a way that makes the probability for two explanations equal in exactly the situation where the statistical test shifts from preferring one explanation to the other. For a given single site variant, the probability is then calculated as the sum of probabilities for all the explanations containing that variant. So if a G variant is called, the reported probability is the sum of probabilities for these configurations: G, A/G, C/G, G/T, A/C/G, A/G/T, C/G/T, and A/C/G/T (and also all the configurations containing deletions together with G).
- Read count
- The number of 'countable' reads supporting the allele. Only 'countable' reads are considered (see under 'Count' above for an explanation of 'countable' reads). Note that each read in an overlapping pair contribute 1. To view the reads in pairs in a reads track as single reads, check the 'Show strands of paired reads' option in the side-panel of the reads track. (Please see the column 'Count' above for a column that reports the value for 'fragments' rather than for 'reads').
- Read coverage
- The read coverage at this position. Only 'countable' reads are considered (see under 'Count' above for an explanation of 'countable' reads). Note that each read in an overlapping pair contribute 1. To view the reads in pairs in a reads track as single reads, check the 'Show strands of paired reads' option in the side-panel of the reads track. (Please see the column 'Coverage' above for a column that reports the value for 'fragments' rather than for 'reads').
- # Unique start positions
- The number of unique start positions for 'countable' fragments that support the variant. This value can be important to look at in cases with low coverage. If all reads supporting the variant have the same start position, you could suspect that it is a result of an amplification error. # Unique start positions is not provided for variants called from a mapping consisting of PacBio or Oxford Nanopore long reads.
- # Unique end positions
- The number of unique end positions for 'countable' fragments that support the variant. This value can be important to look at in cases with low coverage. If all reads supporting the variant have the same end position, you could suspect that it is a result of an amplification error. # Unique end positions is not provided for variants called from a mapping consisting of PacBio or Oxford Nanopore long reads.
- BaseQRankSum
- The BaseQRankSum column contains an evaluation of the quality scores in the reads that have a called variant compared with the quality scores of the reference allele. Reference alleles and variants for which no corresponding reference allele is called do not have a BaseQRankSum value. The score is a z-score derived using the Mann-Whitney U test, so a value of -2.0 indicates that the observed qualities for the variant are two standard deviations below what would be expected if they were drawn from the same distribution as the reference allele qualities. A negative BaseQRankSum indicates a variant with lower quality than the reference variant, and a positive z-score indicates higher quality than the reference. BaseQRankSum is not provided for variants called from a mapping consisting of PacBio or Oxford Nanopore long reads.
- Read position test probability
- The test probability for the test of whether the distribution of the read positions variant in the variant carrying reads is different from that of all the reads covering the variant position.
- Read direction test probability
- Tests whether the distribution among forward and reverse reads of the variant carrying reads is different from that of all the reads covering the variant position. This value reflects a balanced presence of the variant in forward and reverse reads (1: well-balanced, 0: un-balanced). This p-value is based on a statistic that we assume follows a Chi-square(df=2) distribution under the null hypothesis of the variant having equal frequency on reads from both direction. Note that GATK uses a Fisher's exact test for the same purpose. The difference between both approaches lead to a potential overestimation of p-values output by the workbench's variant detection tools.
- Hyper-allelic
- Basic and Fixed Ploidy Variant detectors only: Contains "yes", if the site contains more variants than the user-specified ploidy predicts, "no" if not.
- Genotype
- Fixed Ploidy only: Contains the most probable genotype for the site.
- Homopolymer
- The column contains "Yes" if the variant is likely to be a homopolymer error and "No" if not. This is assessed by inspecting all variants in homopolymeric regions longer than 2. A variant will get the mark "yes" if it is a homopolymeric length variation of the reference allele, or a length variation of another variant that is a homopolymeric variation of the reference allele. When several overlapping homopolymeric variants are identified, all except the most frequent are marked as being homopolymer. However, if one of the overlapping, homopolymeric variants is the reference allele, then all of them are marked as homopolymer.
- QUAL
- Measure of the significance of a variant, i.e., a quantification of the evidence (read count) supporting the variant, relative to the coverage and what could be expected to be seen by chance, given the error rates in the data.
The mathematical derivation of the value is depends on the set of probabilities of generating the nucleotide pattern observed at the variant site (1) by sequencing errors alone and (2) under the different allele models of the variant caller allows. QUAL is calculated as -10log10(1-p), p being the probability that a particular variant exists in the sample. QUAL is capped at 200 for p=1, with 200: highly significant, 0: insignificant. In rare cases, the QUAL value cannot be calculated for specific variant and as a result the QUAL field will be empty. A QUAL value of 10 indicates a 1 in 10 chance that the called variant is an error, while a QUAL of 100 indicates a 1 in
 chance that the called variant is an error.
|
Interpretation of logarithmically linked values
Average quality tells if the reads supporting a variant are likely to have the correct base call, while QUAL tells the confidence of the variant being present in the sample.
|
Please note that the variants in the variant track can be enriched with information using the annotation tools in Filtering and annotating variants.
A variant track can be imported and exported in VCF or GVF formats. An example of the gvf-file giving rise to the variants shown in figure 32.17 is given in figure 32.18.
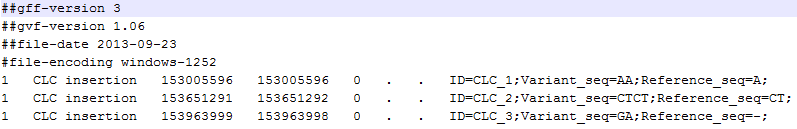
Figure 32.18: A gvf file giving rise to the variants in the figure above.