Peak track
The main output of the Transcription Factor ChIP-Seq tool is an annotation track containing
the peaks. The table view (figure 37.12) can be opened by clicking on the table icon (![]() ) in the lower left
corner of the peak annotation track. For each peak, it contains:
) in the lower left
corner of the peak annotation track. For each peak, it contains:
- Chromosome The chromosome where the peak is located.
- Region The position of the peak.
- Center of peak The center position of the peak. This is determined as the genomic position that matches the peak shape filter best.
- Length The length of the peak.
- Peak shape score The peak shape score of the peak.
- P-value The p-value of the peak.
For more details on some of the values above, see Applying peak shape filters to call peaks. Information about the genes located upstream and downstream of the peaks can be added to the table by using Annotate with Nearby Information.
The peak annotation track is most informative when combined with the read mapping in a track list (figure 37.12), see Track lists for details.
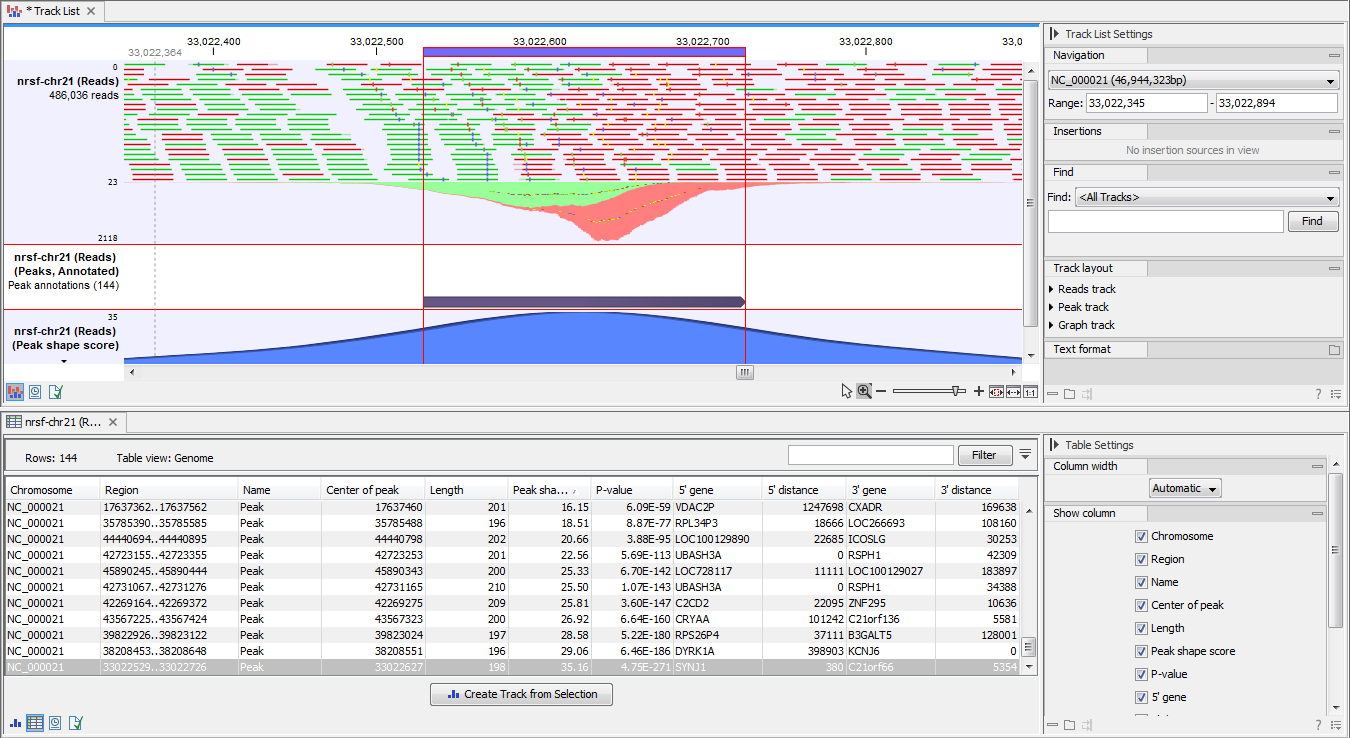
Figure 37.12: Top: Track list containing the mapped reads, the Peak track annotated with nearby genes, and the Peak shape score track. Bottom: Table view of the Peak track. Clicking a peak in the table will update the track list to show the selected peak.