Local complexity plot
In CLC Genomics Workbench it is possible to calculate local complexity for both DNA and protein sequences. The local complexity is a measure of the diversity in the composition of amino acids within a given range (window) of the sequence. The K2 algorithm is used for calculating local complexity [Wootton and Federhen, 1993]. To conduct a complexity calculation do the following:
Tools | Classical Sequence Analysis (![]() ) | General Sequence Analysis (
) | General Sequence Analysis (![]() )| Create Complexity Plot
(
)| Create Complexity Plot
(![]() )
)
This opens a dialog. In Step 1 you can use the arrows to change, remove and add DNA and protein sequences in the Selected Elements window.
When the relevant sequences are selected, clicking Next takes you to Step 2. This step allows you to adjust the window size from which the complexity plot is calculated. Default is set to 11 amino acids and the number should always be odd. The higher the number, the less volatile the graph.
Figure 18.15 shows an example of a local complexity plot.
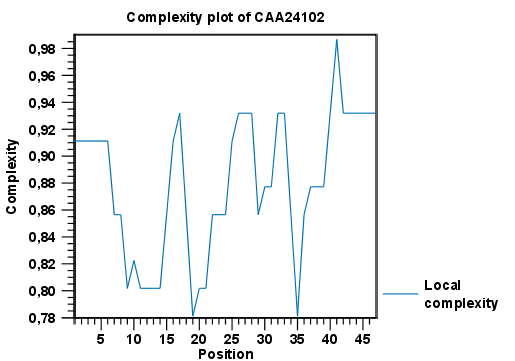
Figure 18.15: An example of a local complexity plot.
Click Finish to start the tool. The values of the complexity plot approaches 1.0 as the distribution of amino acids become more complex.
See Graph preferences for information about the graph view.