Create GC Content Graph
Create GC Content Graph takes a sequence track as input and creates a graph track of the GC content of that sequence.
To run the tool, go to:
Tools | Utility Tools (![]() ) | Tracks (
) | Tracks (![]() ) | Graph Tracks (
) | Graph Tracks (![]() ) | Create GC Content Graph (
) | Create GC Content Graph (![]() )
)
After selecting a sequence track as input (figure 28.22) the window size is specified (figure 28.23). This is the size of the region over which the GC content should be calculated. For example, with a window size of 25, the GC content would be calculated for a region comprised of a central base plus the 12 bases upstream and the 12 bases downstream of it. The value calculated for a given window is assigned to the central base of that window. As there is a single central base, the window size must be an odd number.
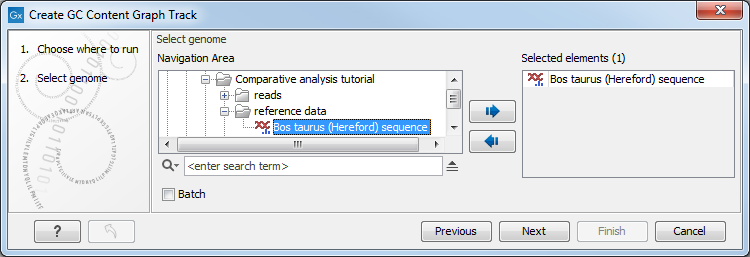
Figure 28.22: Select a sequence track as input to Create GC Content Graph.
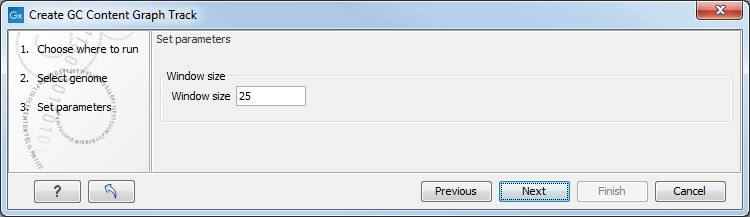
Figure 28.23: Specify the window size. The window size is the region around each individual base that should be used to calculate the GC content in a given region.
The output is a graph track containing the GC content values calculated for each base. When zoomed fully in, hovering the mouse cursor over a position reveals a tooltip with the GC content for that position. This information is also displayed in the bottom right corner of the Workbench frame (figure 28.24).
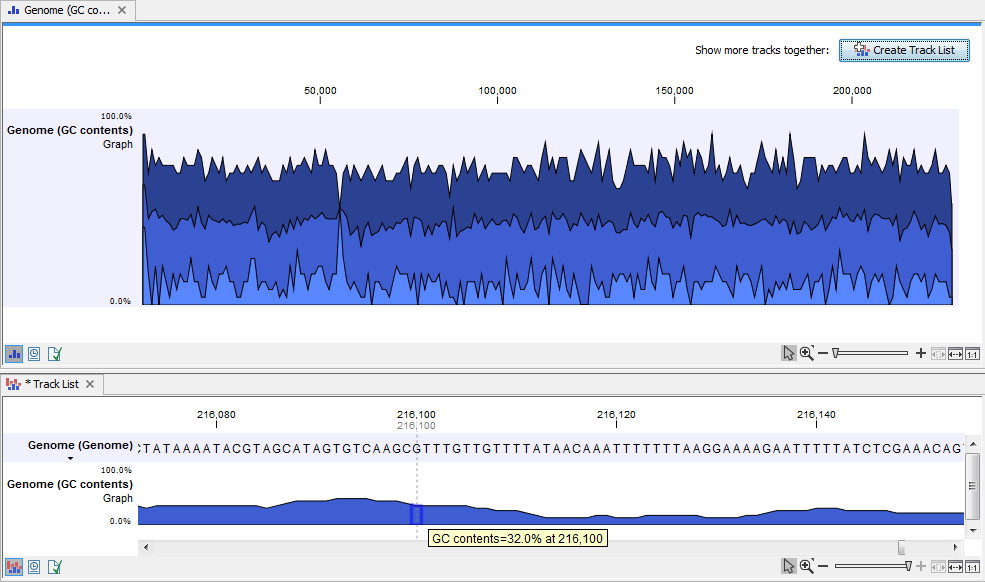
Figure 28.24: A GC content graph track, zoomed in to the single nucleotide level. Hovering the mouse cursor over the track reveals information about the GC content in the window centered on that position.
When zoomed out fully, three overlapping plots in blue are visible (figure 28.25). These display a summary of the GC content values along the sequence. The highest of the three (darkest shade) shows the maximum values, the middle one (medium shade) shows the mean values, and the bottom one (lightest shade) shows the minimum values. Hovering the mouse cursor over a position reveals a tooltip showing information about the range of values and the size of region those values pertain to. This information is also displayed in the bottom right corner of the Workbench frame.
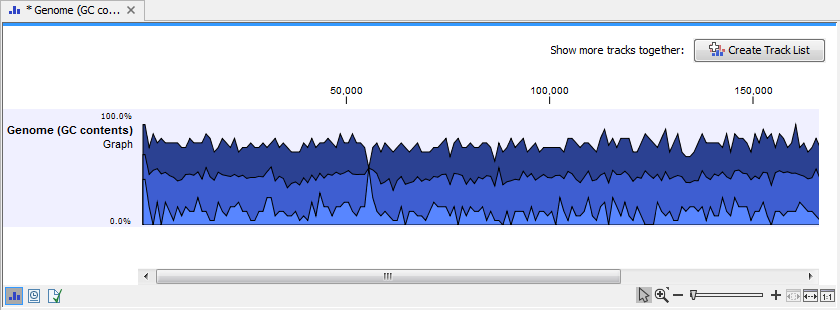
Figure 28.25: The GC content graph track when zoomed out fully contains three plots. These show, respectively, the highest, mean and lowest GC content values along the sequence. Hovering the mouse cursor over the track reveals information about the values in that region.
The y-axis value range to display can be specified in the Track layout palette of the Side Panel. By default, the range displayed is 0 to 100%. Check the "Fix graph bounds" to reveal fields where the value range can be entered. In the context of a Track List, this setting affects the y-axis values for all graph tracks in the list.