Differential Expression for RNA-Seq
Differential Expression for RNA-Seq performs a statistical differential expression test for a set of Expression Tracks. It uses multi-factorial statistics based on a negative binomial GLM. The tool supports paired designs and can control for batch effects. The statistical analysis is described in more detail in The statistical model.
To run the Differential Expression for RNA-Seq tool, you need Expression Tracks (![]() ) and a CLC Metadata Table that provides, at minimum, information about the conditions relevant for the statistical testing. The Expression Tracks provided as input must already have associations to this CLC Metadata Table (see the Metadata chapter).
) and a CLC Metadata Table that provides, at minimum, information about the conditions relevant for the statistical testing. The Expression Tracks provided as input must already have associations to this CLC Metadata Table (see the Metadata chapter).
The RNA-Seq and Differential Gene Expression Analysis template workflow includes Differential Expression for RNA-Seq and illustrates an approach where metadata can be provided in an Excel, CSV or TSV format file, avoiding the need to create a CLC Metadata Table before starting the analysis. See RNA-Seq and Differential Gene Expression Analysis for details.
Running the Differential Expression for RNA-Seq tool
To run Differential Expression for RNA-Seq, go to:
Tools | RNA-Seq and Small RNA Analysis (![]() )| Differential Expression (
)| Differential Expression (![]() ) | Differential Expression for RNA-Seq (
) | Differential Expression for RNA-Seq (![]() )
)
Select a number of Expression tracks (![]() ) and click Next figure 34.85.
) and click Next figure 34.85.
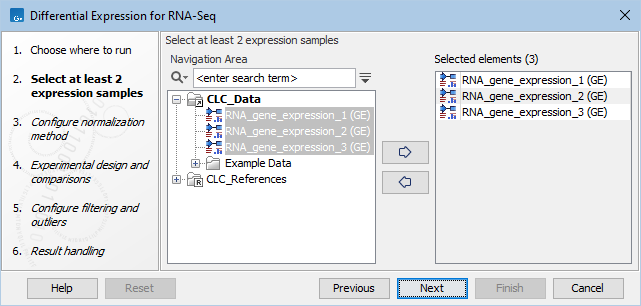
Figure 34.85: Select a number of Expression Tracks.
For Expression Tracks (TE), the values used as input are "Total transcript reads". For Gene Expression Tracks (GE), the values used depend on whether a eukaryotic or prokaryotic organism is analyzed, i.e., if the option "Genome annotated with Genes and transcripts" or "Genome annotated with Genes only" is used. For Eukaryotes the values are "Total Exon Reads", whereas for Prokaryotes the values are "Total Gene Reads".
The order of comparisons can be controlled by changing the order of the inputs.
Normalization options are provided in the "Configure normalization method" step of the wizard (figure 34.86).
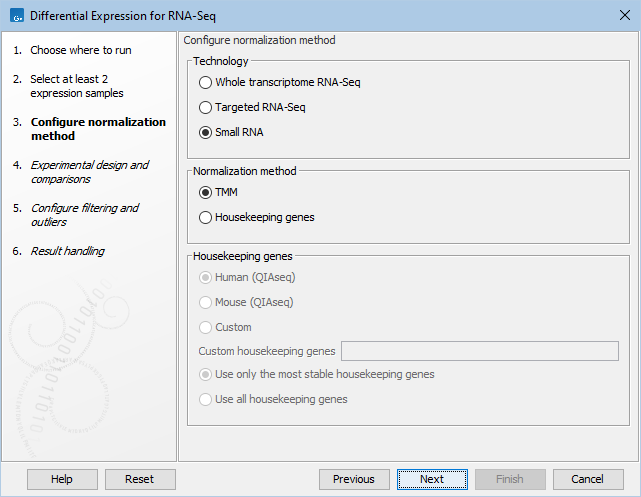
Figure 34.86: Normalization methods.
First, choose the application that was used to generate the expression tracks: Whole transcriptome RNA-Seq, Targeted RNA-Seq, or Small RNA. For Targeted RNA-Seq and Small RNA, you can choose between two normalization methods: TMM and Housekeeping genes, while Whole transcriptome RNA-Seq will be normalized by default using the TMM method. For more detail on the methods see TMM Normalization.
TMM Normalization (Trimmed Mean of M values) calculates effective libraries sizes, which are then used as part of the per-sample normalization. TMM normalization adjusts library sizes based on the assumption that most genes are not differentially expressed.
Normalization with Housekeeping genes can be done when a set of housekeeping genes to use is available: in the "Custom housekeeping genes" field, type the name of the genes separated by a space. Finally choose between these two options:
- Use only the most stable housekeeping genes will use a subset (at least three) of the most stable genes for normalization, these being defined using the GeNorm algorithm [Vandesompele et al., 2002].
- Use all housekeeping genes keep all housekeeping genes listed for normalization.
When working with Targeted RNA Panels, we recommend that normalization is done using the Housekeeping genes method rather than TMM. Predefined list of housekeeping genes are available for samples generated using Human and Mouse QIAseq panels (hover with the mouse on the dialog to find the list of genes included in the set). If you are working with a custom panel, you can also provide the corresponding set of housekeeping genes in the "Custom housekeeping genes" as described above.
In the "Experimental design and comparison" wizard step, you are asked to provide information about the samples, test conditions, and the type of testing to carry out (figure 34.87).
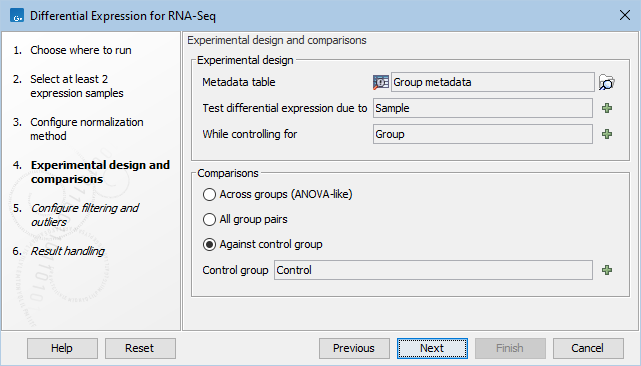
Figure 34.87: Setting up the experimental design and comparisons.
In the Experimental design panel, the following information must be provided:
- Metadata table Specify a CLC Metadata Table containing information about the selected Expression Tracks relevant for the statistical testing, i.e. the factors. The Expression Tracks must already have associations to the selected CLC Metadata Table.
- Test differential expression due to Specify the factor to test for differential expression.
- While controlling for Specify confounding factors, i.e., factors that are not of primary interest, but may affect gene expression.
In the Comparisons panel, the type of test(s) to be run is specified. This affects the number and type of statistical comparison outputs generated (see Output of the Differential Expression for RNA-Seq tool for more details).
Depending on the type of comparison chosen, a Wald test or a Likelihood Ratio test will be used. For example, assume that we test a factor called 'Tissue' with three groups: skin, liver, brain.
- Across groups (ANOVA-like) This mode tests for the effect of a factor across all groups.
- Outputs produced: "Due to Tissue"
- Test used: Likelihood ratio test
- Fold change reports: The maximum pairwise fold change between any two of the three tissue types.
- Max of group means reports: The maximum of the average group TPM values among any of the tissue types for a gene.
- All group pairs tests for differences between all pairs of groups in a factor.
- Outputs produced: "skin vs. liver", "skin vs. brain", "liver vs. brain"
- Test used: Wald test
- Fold change reports: The fold change in the defined order between the named pair of tissue types.
- Max of group means reports: The maximum of the average group TPM values between the two named tissue types.
- Against control group This mode tests for differences between all the groups in a factor and the named reference group. In this example the reference group is skin.
- Outputs produced: "liver vs. skin", "brain vs. skin"
- Test used: Wald test
- Fold change reports: The fold change in the defined order between the named pair of tissue types.
- Max of group means reports: The maximum of the average group TPM values between the two named tissue types.
In the "Configure filtering and outliers" wizard step, you choose whether to downweight outlier expressions, and whether to filter on average expression prior to FDR correction.
Downweighting outliers is appropriate when a standard differential expression analysis is enriched for genes that are highly expressed in just one sample. These genes do not fit the null hypothesis of no change in expression across samples. Downweighting comes at a cost to precision and so is not recommended generally. For more details, see Downweighting outliers.
Filtering maximizes the number of results that are significant at a target FDR threshold, but at the cost of potentially removing significant results with low average expression. For more details, see Filtering on average expression.
The outputs from Differential Expression for RNA-Seq are described in Output of the Differential Expression tools.
Subsections