The pairwise comparison table
The output from Create Pairwise Comparison (![]() ) is a table showing the results of selected comparisons (figure 25.17). Since comparisons are often symmetric, the table can show the results of two comparisons at the same time, one in the upper-right and one in the lower-left triangle of the table.
) is a table showing the results of selected comparisons (figure 25.17). Since comparisons are often symmetric, the table can show the results of two comparisons at the same time, one in the upper-right and one in the lower-left triangle of the table.
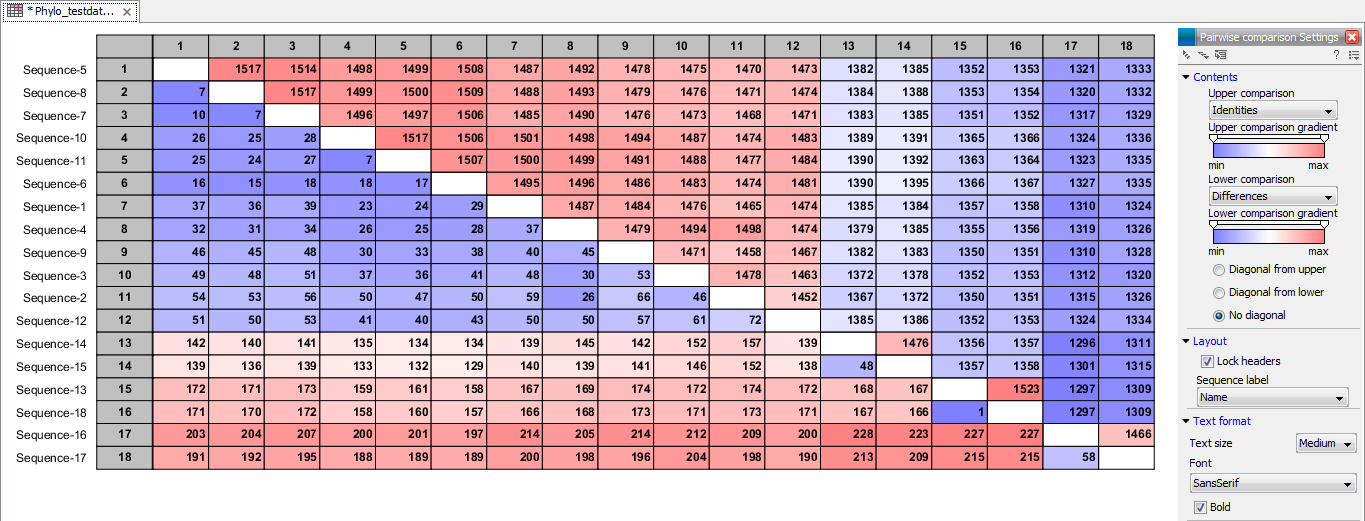
Figure 25.17: A pairwise comparison table.
Note that you can change the minimum and maximum values of the gradient coloring by sliding the corresponding cursor along the gradient in the Side Panel of the comparison table. The values that appear when you slide the cursor reflect the percentage of the range of values in the table, and not absolute values.
The following settings can be configured in the Side Panel:
- In the Contents palette:
- Upper comparison. Select which comparison to show in the upper triangle of the table.
- Upper comparison gradient. Select the color gradient to use for the upper triangle.
- Lower comparison. Select which comparison to show in the lower triangle.
- Lower comparison gradient. Select the color gradient to use for the lower triangle.
- Diagonal from upper. Use this setting to show the diagonal results from the upper comparison.
- Diagonal from lower. Use this setting to show the diagonal results from the lower comparison.
- No diagonal. Leave the diagonal table entries blank.
- In the Layout palette:
- Lock headers. Locks the sequence labels and table headers when scrolling the table.
- Sequence label on top. Changes the sequence labels of the horizontal axis. Choose "None" in the drop-down menu to disable the labels.
- Sequence label on left side. Changes the sequence labels of the vertical axis. Choose "None" in the drop-down menu to disable the labels.
- In the Text format palette:
- Text size. Change the size of the table and the text within it.
- Font. Change the font in the table.
- Bold. Check this option to apply bold formatting of the text in the table.