Visualizing, zooming and navigating tracks
Side Panel
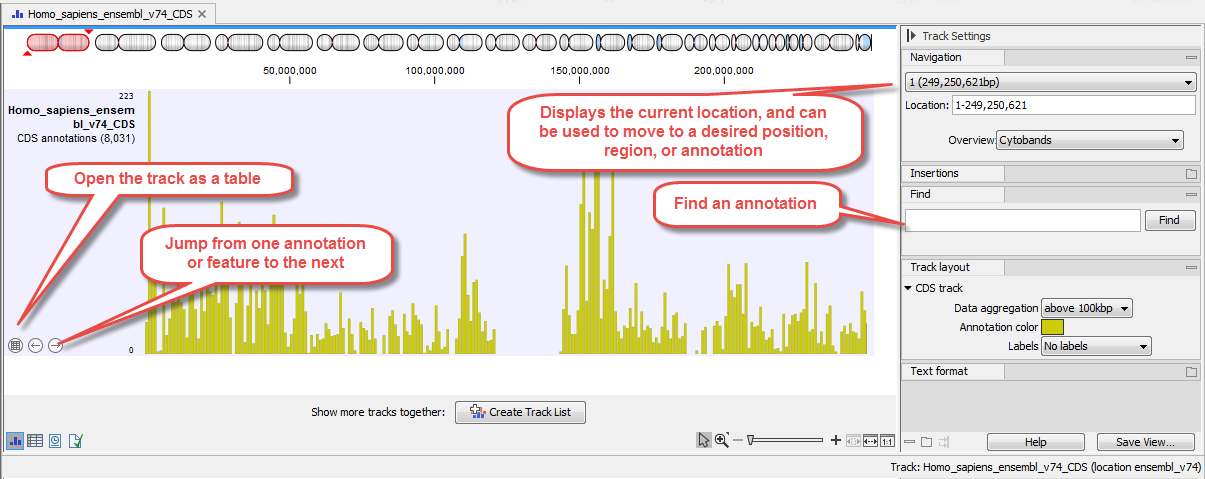
The Side Panel is shown to the right of a track opened in the View Area (figure 27.6). The settings generally allow users to navigate the track using a specific position on a specific chromosome, to find a particular nucleotide sequence or annotation, and to change the text format.

Figure 27.6: A CDS track with its Side Panel visible to the right.
In the Navigation section of the Track Side Panel, the upper field gives information about which chromosome is currently shown. The drop-down list can be used to jump to a different chromosome. The Location field displays the start and end positions of the shown region of the chromosome, but can also be used to navigate the track: enter a range or a single location point to get the visualization to zoom in the region of interest. It is also possible to enter the name of a chromosome (MT: or 5:), the name of a gene or transcript (BRCA" or DHFR-001), or even the range on a particular gene or transcript (BRCA2:122-124) Finally, the Overview drop-down menu defines what is shown above the track: cytobands, or cytobands with aggregated data. It can also be hidden all together.
Additional settings specific to the type of track being open can be available. For example, you can change a Reads track layout as explained in Reads tracks Side Panel settings. Similarly, when working with annotation tracks, the settings Track Layout | Labels controls where labels will be displayed in relation to the annotations (figure 27.7).

Figure 27.7: The Side Panel for annotation tracks showing the Labels drop down menu.
Once you have changed the visualization of the track to your liking, it is possible to save the settings as described in Side Panel view settings.
Additional tools
In a reads track, a vertical scroll bar will appear to the right of the reads when hovering on them to navigate through high coverage regions.
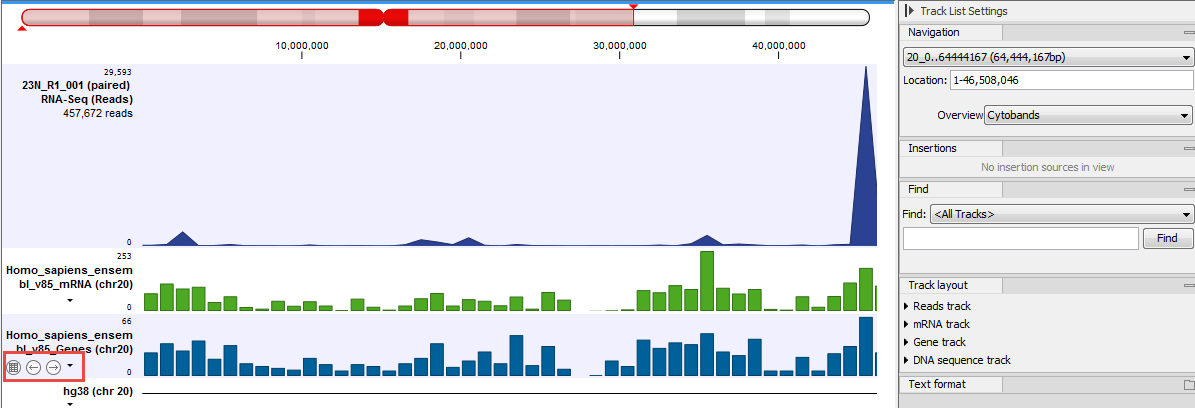
Specified tracks have buttons that will appear under the track name on the left side of the View Area (highlighted in figure 27.8): these buttons can be used to open the track as a table, or jump to the previous and next element.

Figure 27.8: Hovering on a track will show additional buttons under the track name.
Zooming
Clicking on icons in the bottom, right corner of the View area allows you to zoom in and zoom out.
- To zoom in to 100 % to see the data at base level, click the Zoom to base level (
 ) icon.
- To zoom out to see all the data, click the Zoom to Fit (
 ) icon.
Navigation and zooming shortcuts
You can also use the zoom and scroll shortcuts described in the table below:
| Action | Windows/Linux | macOS |
| Vertical scroll in reads tracks | Alt + Scroll wheel | Alt + Scroll wheel |
| Vertical scroll in reads tracks, fast | Shift+Alt+Scroll wheel | Shift+Alt+Scroll wheel |
| Vertical zoom in graph tracks | Ctrl + Scroll wheel | |
| Zoom | Ctrl + Scroll wheel | |
| Zoom In Mode | Ctrl + 2 | |
| Zoom In (without clicking) | '+' (plus) | '+' (plus) |
| Zoom Out Mode | Ctrl + 3 | |
| Zoom Out (without clicking) | '-' (minus) | '-' (minus) |
| Zoom to base level | Ctrl + 0 | |
| Zoom to fit screen | Ctrl + 6 | |
| Zoom to selection | Ctrl + 5 | |
| Reverse zoom mode | press and hold Shift | press and hold Shift |
