Gel view
In figure 24.53 you can see a simulation of a gel with its Side Panel to the right.
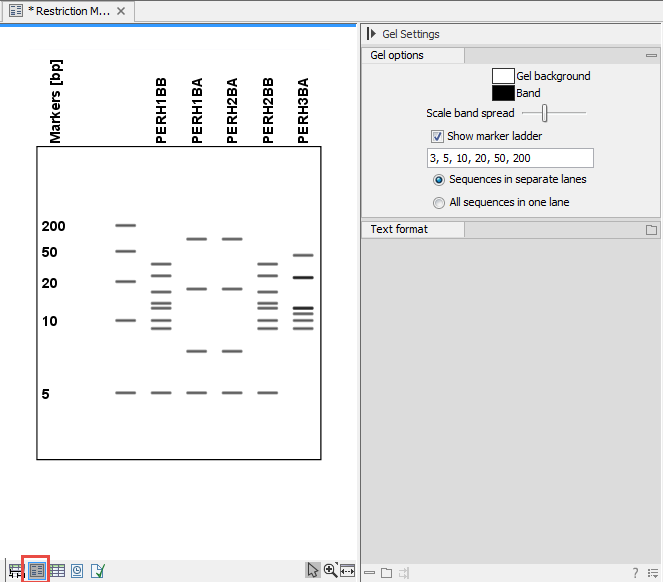
Figure 24.53: Five lanes showing fragments of five sequences cut with restriction enzymes.
Information on bands / fragments
You can get information about the individual bands by hovering the mouse cursor on the band of interest. This will display a tool tip with the following information:
- Fragment length
- Fragment region on the original sequence
- Enzymes cutting at the left and right ends, respectively
For gels comparing whole sequences, you will see the sequence name and the length of the sequence.
Note! You have to be in Selection (![]() ) or Pan (
) or Pan (![]() ) mode in order to get this information.
) mode in order to get this information.
It can be useful to add markers to the gel which enables you to compare the sizes of the bands. This is done by clicking Show marker ladder in the Side Panel.
Markers can be entered into the text field, separated by commas.
Modifying the layout
The background of the lane and the colors of the bands can be changed in the Side Panel. Click the colored box to display a dialog for picking a color. The slider Scale band spread can be used to adjust the effective time of separation on the gel, i.e. how much the bands will be spread over the lane. In a real electrophoresis experiment this property will be determined by several factors including time of separation, voltage and gel density.
You can also choose how many lanes should be displayed:
- Sequences in separate lanes. This simulates that a gel is run for each sequence.
- All sequences in one lane. This simulates that one gel is run for all sequences.
You can also modify the layout of the view by zooming in or out. Click Zoom in (![]() ) or Zoom out (
) or Zoom out (![]() ) in the Toolbar and click the view.
) in the Toolbar and click the view.
Finally, you can modify the format of the text heading each lane in the Text format preferences in the Side Panel.