The Table view
The information stored by many Track types can be viewed in a table. To open the table, click on (![]() ) at the bottom of the track.
) at the bottom of the track.
The table contains a row for each item in the track. Positional information (e.g. Chromosome, Region) is always included. The other information present depends on the type of data in the track (figure 28.9.
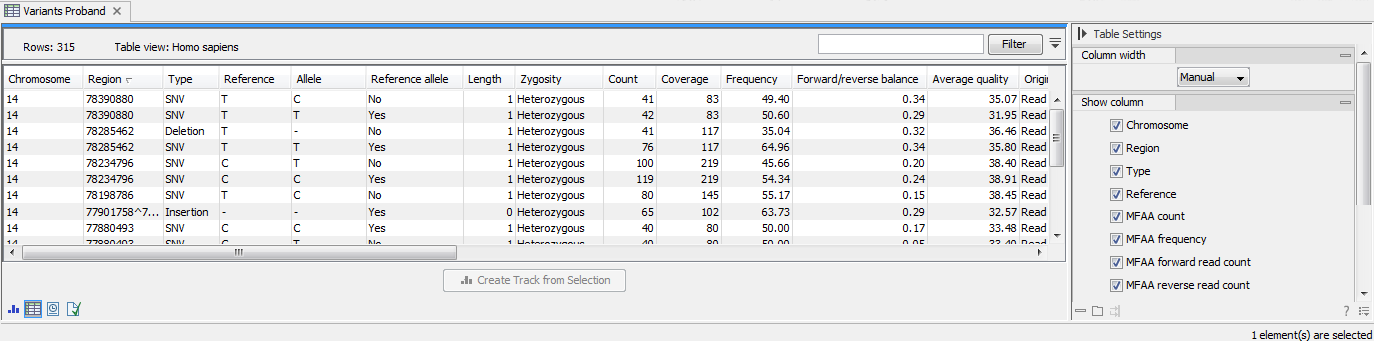
Figure 28.9: Table view of a variant track. Positional information is provided in the first two columns, with the remaining columns containing information relevant to variant data. The full list of columns available for this track is provided in the Side Panel. Only the columns selected there are displayed in the table.
See Working with tables for further information about working with tables.
Linked views
Opening the graphical and table views of a track in linked views makes it easy to navigate to positions of interest. Selecting rows in the table selects the corresponding items in the graphical view and move the focus in the graphical view to those items where possible. Conversely, selecting items in the graphical view selects the corresponding rows in the table.
From the graphical view of a track, the table can be opened in a linked view using one of the following methods:
- Press Ctrl (
 on Mac) while clicking (
 ).
).
- Right-click on the track tab, and select "Show View | Table".
For further details about working with different views for the same data element, see View Area.
Note: Filtering the table in a linked view, so that only a subset of rows is visible, does not affect the contents of the graphical view. To manually create a track containing a subset of the available items, select the rows of interest and click on the Create Track from Selection button at the bottom of the table view. Several tools for creating tracks with a subset of items are also available, including: