Variance table
In addition to the standard graphical display of a contig or mapping as
described in View and edit contigs and read mappings, you can also see a tabular
overview of the conflicts between the reads by clicking the Table (![]() ) icon at the bottom of the view.
) icon at the bottom of the view.
This will display a new view of the conflicts as shown in figure 23.19.
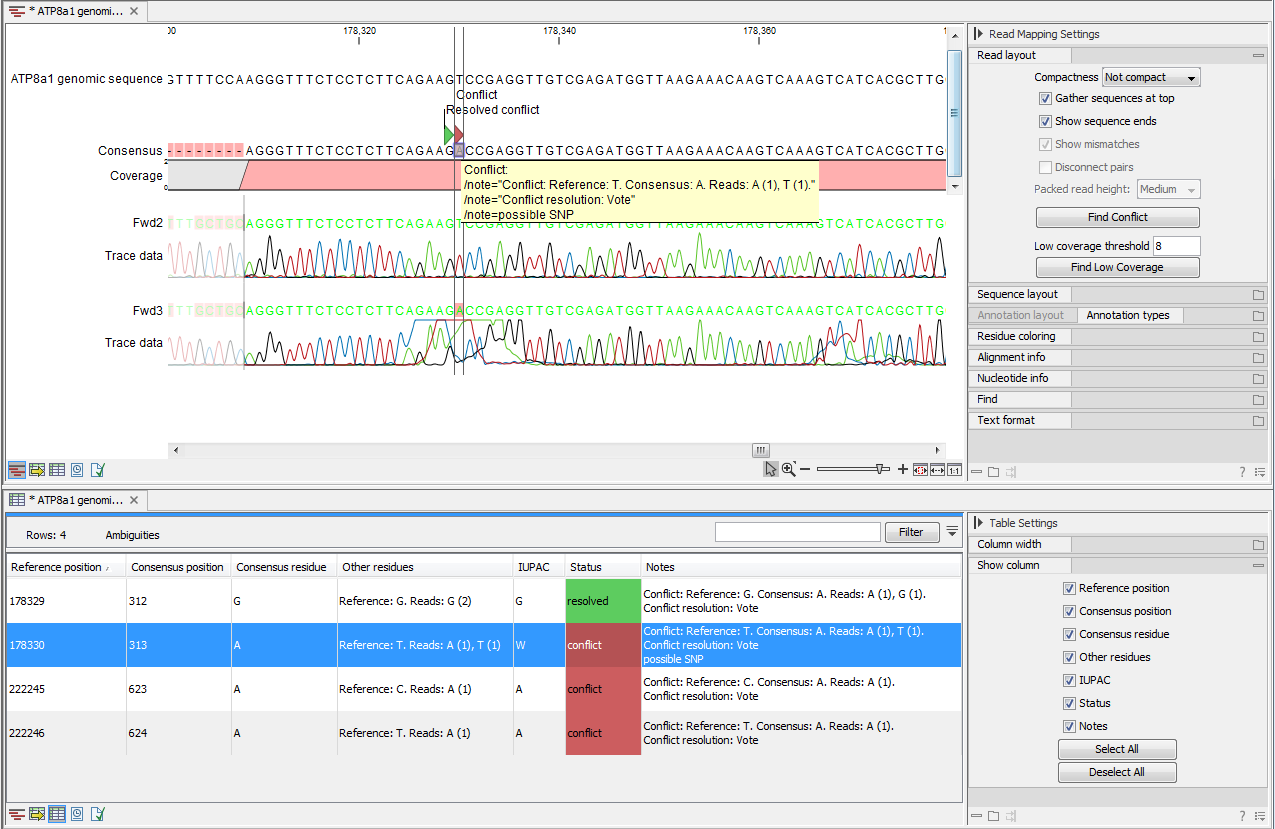
Figure 23.22: The graphical view is displayed at the top, and underneath the conflicts are shown in a table. At the conflict at position 313,
the user has entered a comment in the table (to see it, make sure the Notes column is wide enough to display all text lines). This comment is now also added to the tooltip of the conflict annotation in the graphical view above.
The table has the following columns:
- Reference position. The position of the conflict measured from the starting point of the reference sequence.
- Consensus position. The position of the conflict measured from the starting point of the consensus sequence.
- Consensus residue. The consensus's residue at this position. The residue can be edited in the graphical view, as described in View and edit contigs and read mappings.
- Other residues. Lists the residues of the reads. Inside the brackets, you can see the number of reads having this residue at this position. In the example in figure 23.19, you can see that at position 637 there is a 'C' in the top read in the graphical view. The other two reads have a 'T'. Therefore, the table displays the following text: 'C (1), T (2)'.
- IUPAC. The ambiguity code for this position. The ambiguity code reflects the residues in the reads - not in the consensus sequence. (The IUPAC codes can be found
in the Appendix.)
Status. The status can either be conflict or
resolved:
- Conflict. Initially, all the rows in the table have this status. This means that there is one or more differences between the sequences at this position.
- Resolved. If you edit the sequences, e.g. if there was an error in one of the sequences, and they now all have the same residue at this position, the status is set to Resolved.
 ).
).
By clicking a row in the table, the corresponding position is
highlighted in the graphical view. Clicking the rows
of the table is another way of navigating the contig or the mapping, as are
using the Find Conflict button or using the Space
bar. You can use the up and down arrow keys to navigate the rows of
the table.