Graphical overview for each query sequence
Double clicking on a given row of a tabular blast table opens a graphical overview of the blast results for a particular query sequence, as shown in figure figure 17.11. In cases where only one sequence was entered into a BLAST search, such a graphical overview is the default output.
Figure 17.11 shows an example of a BLAST result for an individual query sequence in the CLC Genomics Workbench.
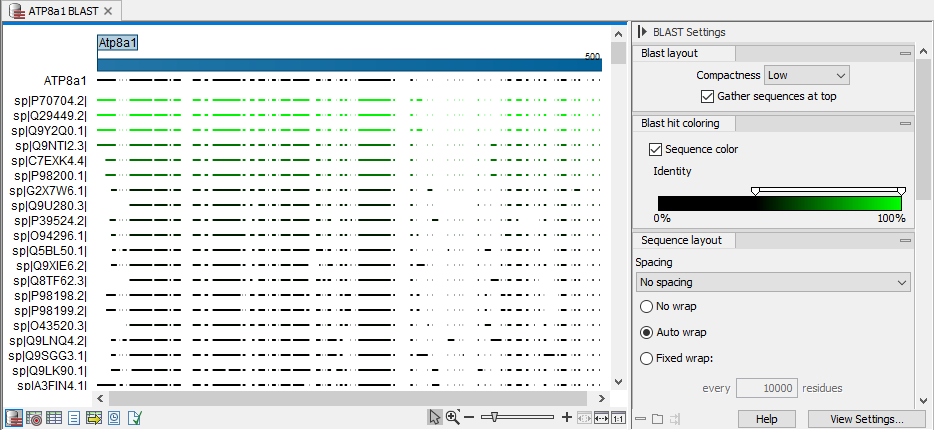
Figure 17.11: Default display of the output of a BLAST search for one query sequence. At the top is there a graphical representation of BLAST hits with tooltips showing additional information on individual hits.
Detailed descriptions of the overview BLAST table and the graphical BLAST results view are described below.