View alignments
Alignments have four available views:
- Alignment (
 ) view. The default view when visualizing the alignment. This view is described in the following sections.
- Primer Designer (
 ) view. Allows the user to design PCR primers and TaqMan probes, see alignment-based primer and probe design.
- Annotation Table (
 ) view. A table containing the annotations on the sequences, see view annotations in a table.
- Table (
 ) view. A sequence table like the one on sequence lists.
Note that alignments have a "Create New Alignment" button at the bottom of the view, similar to the "Create New Sequence List" button available for sequence lists, to easily make alignments of a subset of the sequences.
The standard Side Panel options in the Alignment view, are the same as for sequences, described in Sequence view.
Alignment-specific options are described here.
Sequence layout
In addition to the standard options for sequences in the Side Panel palette Sequence layout, alignments contain the following options:
- Align labels. Whether to align the sequence names to the left or right within the sequence label area on the left-hand side of the Alignment view.
- Show selection boxes. Enables selection boxes to the left of sequences (see also selection in alignments).
- Matching residues as dots. Replaces matching residues with dots, only mismatches/gaps are shown in letters/dashes.
- Alignment on top. Moves the aligned sequences relative to other elements shown in the Alignment view. When checked, the alignment is shown at the top of the view and when unchecked, the alignment is shown underneath other included summary information such as Consensus, Conservation, and Sequence logo.
Residue coloring
Alignments have one extra method of residue coloring, to color any gaps in the alignment:
- Color gaps.
- Foreground color. Sets the color of the gap symbol (dashes). Click the color box to change the color.
- Background color. Sets the background color of the gaps. Click the color box to change the color.
Alignment info
The entire Side Panel palette Alignment info is specific to alignments.
Note that the data points for graph representations can be exported, see export graph data points to a file.
Consensus
Shows a consensus sequence in the Alignment view. The consensus sequence is a single, artificial sequence derived from the alignment. It represents the most common nucleotide or amino acid at each position across all aligned sequences. If all sequences in the alignment are identical, the consensus will match them exactly. When there are differences, the consensus reflects the most frequent residues at each position, summarizing the overall sequence conservation. Parameters for adjusting the consensus sequences are described below.
- Show. Whether to show the consensus sequence in the Alignment view or not. Must be checked for the following options to appear.
- Limit. This option determines how conserved the sequences must be in order to agree on a consensus.
Nucleotide alignments have an extra option ("IUPAC"). When this option is selected, the relevant ambiguity code is displayed when there are differences between the sequences. Nucleotide ambiguity codes and their definitions are listed in IUPAC codes for nucleotides.
- No gaps. Checking this option will not show gaps in the consensus.
- Ambiguous symbol. Select how ambiguities should be displayed in the consensus line (as N, ?, *, ., or -). This option has no effect if "IUPAC" is selected in the drop-down Limit list above.
The consensus sequence can be opened in a new view by right-clicking on the consensus sequence and choosing Open Consensus in New View.
Conservation
Displays the level of conservation at each position in the alignment.
- Foreground color. Colors the residue symbols using a gradient, where the right side color is used for highly conserved positions and the left side color is used for positions that are less conserved.
- Background color. Sets a background color of the residues using a gradient in the same way as described above for "Foreground color".
- Graph. Displays a conservation graph, with the height of the bar, or the gradient of the color, reflecting how conserved that particular position is in the alignment. If a position is 100% conserved, the bar will be shown in full height or it will be colored in the color specified at the right side of the gradient slider.
- Height. Specifies the height of the graph.
- "Type" drop-down menu. The type of the graph to show: Line plot, Bar plot, or Colors. The latter changes the graph to a color bar using a gradient to visualize conservation level.
- Color box. Specifies the color of the graph for Line and Bar plots, or specifies a gradient for Colors.
Gap fraction
Displays the fraction of the sequences in the alignment that have gaps. This is only relevant if there are gaps in the alignment.
- Foreground color. Colors the residue symbols using a gradient, where the left side color is used if there are relatively few gaps, and the right side color is used if there are relatively many gaps.
- Background color. Sets a background color of the residue symbols using a gradient in the same way as described above for "Foreground color".
- Graph. Displays a gap fraction graph, with the height of the bar, or the gradient of the color, reflecting the fraction of gaps at that particular position in the alignment. If a position has many gaps, the bar will be shown close to full height or it will be colored in the color specified at the right side of the gradient slider.
- Height. Specifies the height of the graph.
- "Type" drop-down menu. The type of the graph to show: Line plot, Bar plot, or Colors. The latter changes the graph to a color bar using a gradient to visualize gap fraction.
- Color box. Specifies the color of the graph for Line and Bar plots, or specifies a gradient for Colors.
Color different residues
Indicates differences in aligned residues.
- Foreground color. Colors the residue symbols. Click the color box to change the color.
- Background color. Sets a background color of the residue symbols. Click the color box to change the color.
Sequence logo
A sequence logo displays the frequencies of residues at each position in an alignment. This is represented as the relative heights of letters, along with the degree of sequence conservation as the total height of a stack of letters, measured in bits of information. The vertical scale is in bits, with a maximum of 2 bits for nucleotides and approximately 4.32 bits for amino acid residues. For more details, see Bioinformatics explained: Sequence logo.
- Foreground color. Colors the residue symbols using a gradient according to the information content of the alignment column. Low values indicate columns with high variability whereas high values indicate columns with similar residues.
- Background color. Sets a background color of the residue symbols using a gradient in the same way as described above for "Foreground color".
- Logo. Displays the sequence logo graph in the Alignment view.
- Height. Specifies the height of the graph.
- Colors. The sequence logo can be displayed in black or Rasmol colors. For protein alignments, a Polarity color scheme is also available, where hydrophobic residues are shown in black color, hydrophilic residues as green, acidic residues as red, and basic residues as blue.
Nucleotide info
For nucleotide sequence alignments, there is an extra checkbox in the Side Panel palette Nucleotide info under "Translation", called Relative to top sequence. Checking this box will make the reading frames for the translation align with the top sequence so that you can compare the effect of nucleotide differences on the protein level.
Positional stats
The Side Panel palette Positional stats provides site-specific information about the alignment. Hover the mouse cursor over a position in the alignment or make a selection to populate the tab with information (figure 25.8).
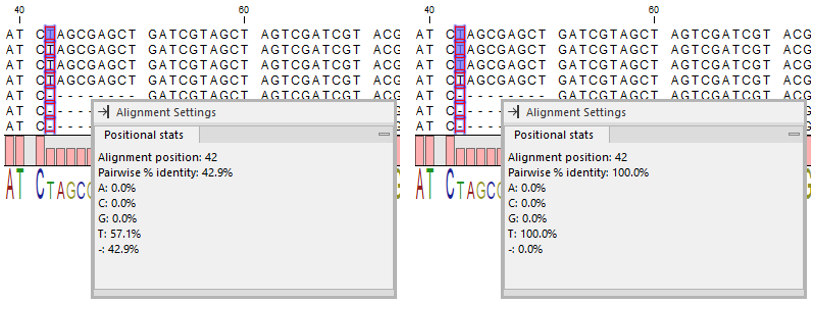
Figure 25.8: Contents of the "Positional stats" palette when a single position is selected across all sequences (Left) and when a single position is selected across three sequences (Right). Note that the palette can be dragged into the Alignment view.
The following information is provided:
- Alignment position. The selected position in the alignment. Visible if hovering over the alignment without any selection or if a single position is selected across all sequences (see difference between (Left) and (Right) in figure 25.8).
- Selected symbols. The number of residues included across all selected positions and sequences.
- Selected sequences. The number of selected sequences.
- Lengths. Min., Max., and Avg. length statistics of the selected sequences.
- Pairwise % identity. Average percent identity. All pairs of residues at the same position are compared. The number of identical pairs is counted and divided by the total number of pairs. The count of ambiguity characters is scaled to the number of residues they can represent, for example a G compared to an R (A or G) is given the value 0.5.
- Example calculation for an alignment with the nucleotides A, A, and G in the tested position: There are three pairwise comparisons, A to A = 1, A to G = 0, and A to G = 0. The pairwise % identity is then 33.3.
- Residue symbol table. Statistics on residues in a tabular format.
- Symbol. List of the four nucleotide symbols or the 20 amino acid symbols, plus the gap symbol (dash).
- %. Percentage of the residue symbols at the selected position(s).
- Count. Number of the residue symbols at the selected position(s).
Subsections