Histone Chip-Seq
ChIP-Seq experiments are increasingly used to investigate histone modifications. In contrast to transcription factors, histone marks are of variable length and can span across entire gene bodies. Although the experimental procedures are similar, the resulting data needs to be treated accordingly to take this variability into account. While narrow peaks resulting from Transcription Factor ChIP-Seq can be detected using a fixed window size, broad peak detection has to cope with the additional boundary-problem in the sense that the distance between start and end depends on the regions of the underlying genes.
Some existing approaches [Heinz et al., 2010] first detect narrow peaks using a fixed window size, and then merge close peaks in order to avoid the computational cost of finding regions of variable length. Nevertheless, different histone marks can also exhibit distinct shapes across gene bodies [Li et al., 2007], which renders them amenable to a shape-based detection algorithms.
By using existing annotations, the Histone ChIP-Seq tool is able to classify gene regions according to the peak shape and thereby provides a good practical trade-off between computational complexity and biological sensitivity. The primary application areas are the analysis of ChIP-Seq data for diverse histone-modifications such as (mono-, di-, and tri-) methylation, acetylation, ubiquitination, etc., in combination with a set of annotated gene regions. The tool is well suited to analyze data from organisms with available gene annotations, while finding peaks in intergenic regions can be accomplished with the Transcription Factor ChIP-Seq tool.
To run the Histone ChIP-Seq tool:
Tools | Epigenomics Analysis (![]() ) | Histone ChIP-Seq (
) | Histone ChIP-Seq (![]() )
)
In the first wizard window, select the mapped ChIP-Seq reads as input data (figure 37.1). Multiple inputs (such as replicate experiments) are accepted, provided that they refer to the same genome. It is also possible to work in batch (see Batch processing).
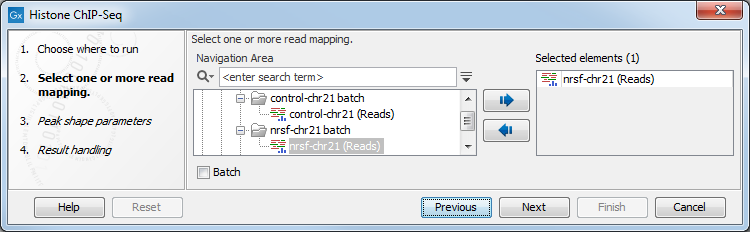
Figure 37.1: Selecting input tracks for the Histone ChIP-Seq tool.
In the second step (figure 37.2), the gene track and control data are defined, along with the p-value. This value defines which regions have a significant fit with the peak-shape, and only these are copied to the output track.
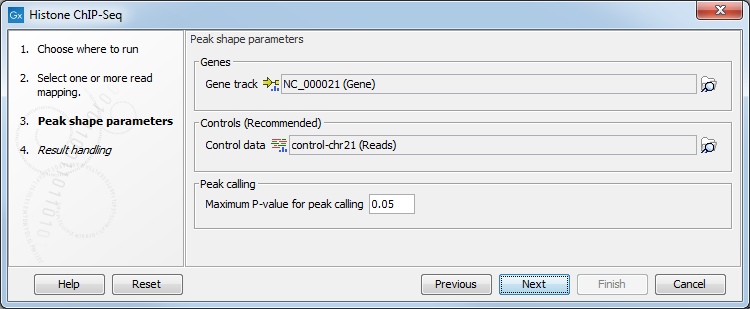
Figure 37.2: Setting peak shape parameters.
The output options are shown in figure 37.3.
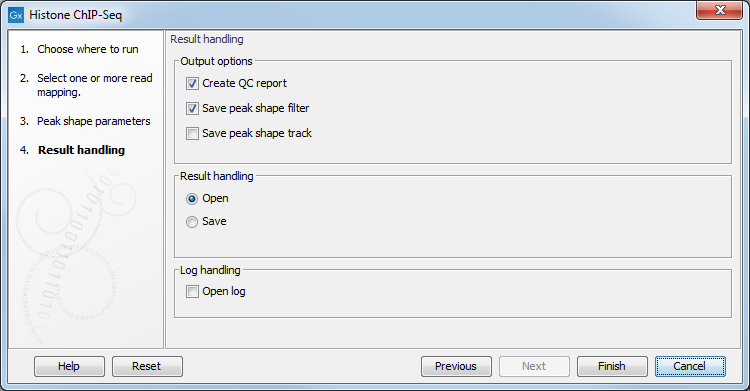
Figure 37.3: Setting up result handling.
- Create a Quality Control (QC) report with which you can check the quality of the reads. It lists the
number of mapped reads, the normalized strand coefficient, and the relative
strand correlation for each mapping. For each metric, the Status column will
be OK if the experiment has good quality or Low if the metric is not as high as expected.
Furthermore, the QC report will show the mean read length, the inferred fragment length, and the window size that the algorithm would need to be able to model the signal shape. In case the input contains paired-end reads, the report will also contain the empirical fragment length distribution.
- Save the peak-shape filter generated by the tool while processing. This filter can be used to identify
genomic regions whose read coverage profile matches the characteristic peak
shape, as well as to determine the statistical significance of this match.
The filter implemented is called Hotelling Observer and was chosen because it
is the matched filter that maximizes the AUCROC (Area Under the Curve of the
Receiver Operator Characteristic), one of the most widely used measures for algorithmic performance.
For a more detailed description of peak-shape filters, see Learning peak shapes, or the white-paper explaining the algorithmic and statistical methods https://digitalinsights.qiagen.com/files/whitepapers/whitepaper-chip-seq-analysis.pdf.
The peak-shape filter is then applied to the experimental data by scaling the coverage profile in
every gene region to a unit-window. The score is obtained for each region by comparing this profile to the
peak shape filter.
- Save peak shape score graph track (figure 37.4)
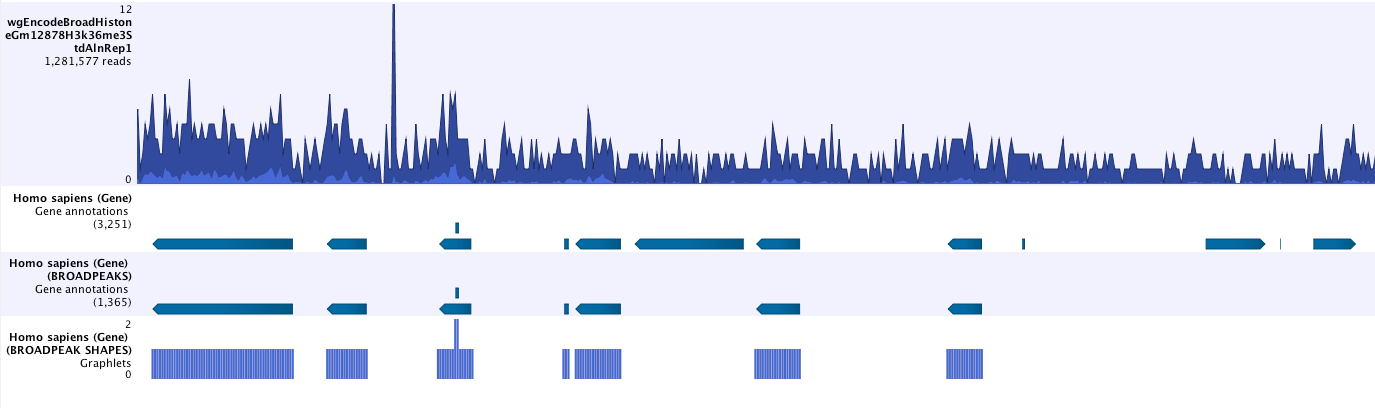
Figure 37.4: Example of Histone ChIP-Seq output.The peak shape score is standardized and follows a standard normal distribution, so a p-value for each regions is calculated. After the peak shape score for all regions is calculated, regions where the peak shape score is greater than the given threshold are copied to the output track. Hence the output only contains the gene regions where the coverage graph does match the peak-shape.