Restriction Site Analysis
To run the Restriction Site Analysis tool, go to:
Tools | Molecular Biology Tools (![]() ) | Cloning (
) | Cloning (![]() )| Restriction Analysis and Cloning (
)| Restriction Analysis and Cloning (![]() ) | Restriction Site Analysis (
) | Restriction Site Analysis (![]() )
)
You first specify the sequences to analyze, and in the next step, which enzymes to use (figure 24.37).

Figure 24.37: Selecting the enzymes to analyze.
Enzymes can be selected using one or both of the following options:
- Enzymes from database. Click the add (
 ) button to open the "Enzymes from database" dialog (figure 24.38).
A list of pre-defined enzymes are shown in the left panel. Select the enzymes of interest as described in Manage enzymes.
- Enzymes from list. Select an existing enzyme list (
 ) from the Navigation Area.

Figure 24.38: Selecting enzymes from the database.
In the next wizard step, you can limit the list of sites reported, depending on how many times they cut a sequence (figure 24.39). The default is to report enzymes that cut the sequence once or twice.
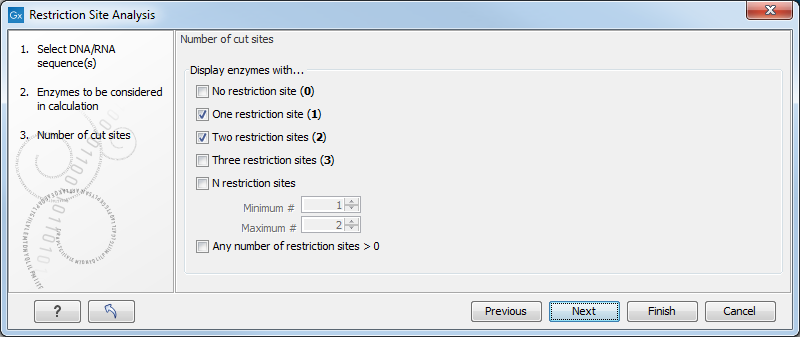
Figure 24.39: Selecting number of cut sites.
The last wizard step (figure 24.40) lets you specify how the result of the restriction analysis should be presented:
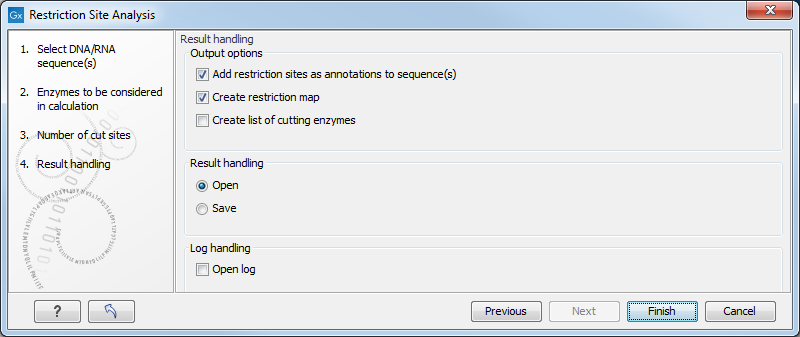
Figure 24.40: Choosing to add restriction sites as annotations or create a restriction map.
- Add restriction sites as annotations to sequence(s). This option makes it possible to see the restriction sites on the sequence (figure 24.41) and save the annotations for later use.
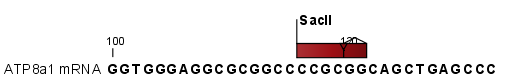
Figure 24.41: The result of the restriction analysis shown as annotations. - Create restriction map. When a restriction map is created, it can be shown in three different ways:
- As a table of restriction sites (figure 24.42). If multiple sequences were selected, the table will include the restriction sites of all the sequences. This makes it easy to compare the result of the restriction analysis for two sequences.
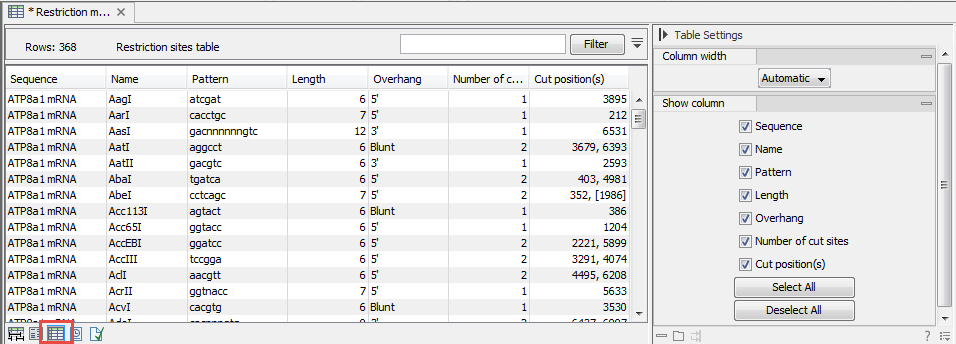
Figure 24.42: The result of the restriction analysis shown as a table of restriction sites.Each row in the table represents a restriction enzyme. The following information is available for each enzyme:
- Sequence. The name of the sequence. This is relevant if you have performed restriction analysis on more than one sequence.
- Name. The name of the enzyme.
- Pattern. The recognition sequence of the enzyme.
- Length. The restriction site length.
- Overhang. The overhang produced by cutting with the enzyme (3', 5', or blunt).
- Number of cut sites. The number of restriction sites where the enzyme cuts.
- Cut position(s). The position of each cut.
If the enzyme's recognition sequence is on the negative strand, the cut position is put in brackets [].
Some enzymes cut the sequence twice for each recognition site, and in this case the two cut positions are surrounded by parentheses ().
- As a table of fragments which shows the sequence fragments that would be the result of cutting the sequence with the selected enzymes (figure 24.43). Click the Fragments button (
 ) at the bottom of the view to see this table.
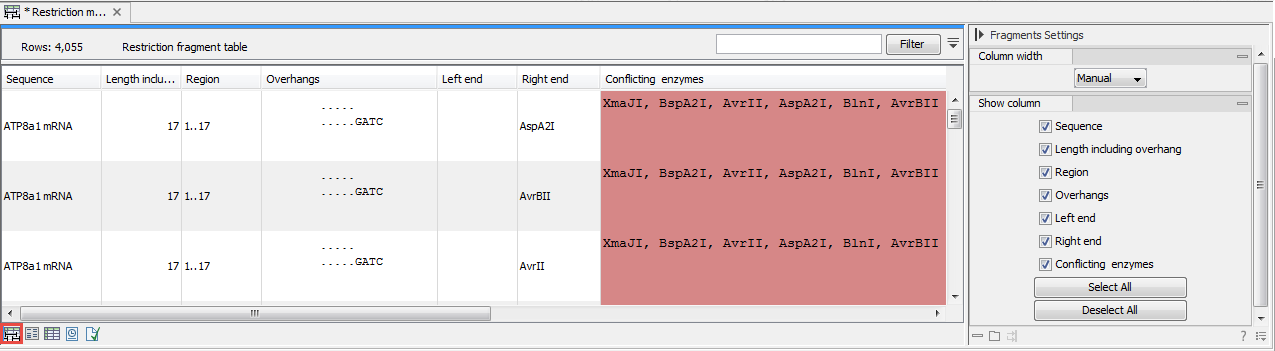
Figure 24.43: The result of the restriction analysis shown as a table of fragments.Each row in the table represents a fragment. If more than one enzyme cuts in the same region, or if an enzyme's recognition site is cut by another enzyme, there will be a fragment for each of the possible cut combinations. Furthermore, if this is the case, you will see the names of the other enzymes in the Conflicting enzymes column. The following information is available for each fragment:
- Sequence. The name of the sequence, which is relevant if you have performed restriction analysis on more than one sequence.
- Length including overhang. The length of the fragment. If there are overhangs of the fragment, these are included in the length (both 3' and 5' overhangs).
- Region. The fragment's region on the original sequence.
- Overhangs. If there is an overhang, this is displayed with an abbreviated version of the fragment and its overhangs. The two rows of dots (.) represent the two strands of the fragment and the overhang is visualized on each side of the dots with the residue(s) that make up the overhang. If there are only the two rows of dots, it means that there is no overhang.
- Left end. The enzyme that cuts the fragment to the left (5' end).
- Right end. The enzyme that cuts the fragment to the right (3' end).
- Conflicting enzymes. If more than one enzyme cuts at the same position, or if an enzyme's recognition site is cut by another enzyme, a fragment is displayed for each possible combination of cuts. At the same time, this column will display the enzymes that are in conflict. If there are conflicting enzymes, they will be colored red to alert the user. If the same experiment were performed in the lab, conflicting enzymes could lead to wrong results. For this reason, this functionality is useful to simulate digestions with complex combinations of restriction enzymes.
If views of both the fragment table and the sequence are open, clicking in the fragment table will select the corresponding region on the sequence.
- As a virtual gel simulation which shows the fragments as bands on a gel (figure 24.53). For more information about gel electrophoresis, see Gel electrophoresis.
- As a table of restriction sites (figure 24.42). If multiple sequences were selected, the table will include the restriction sites of all the sequences. This makes it easy to compare the result of the restriction analysis for two sequences.