Score Regions
The Score Regions tool allows you to apply a new peak shape filter to score genomic regions according how they match a given peak shape.
To run the Score Regions tool:
Tools | Epigenomics Analysis (![]() ) |
Advanced Peak Shape Tools (
) |
Advanced Peak Shape Tools (![]() ) | Score Regions (
) | Score Regions (![]() )
)
This will open up the wizard shown in figure 37.36 where
you can select the input data (e.g. mapped ChIP-Seq reads). Multiple inputs are
accepted, provided that they refer to the same genome. Track based read
mappings (![]() ) and stand-alone read mappings (
) and stand-alone read mappings (![]() ) /
(
) /
(![]() ) are both accepted.
) are both accepted.
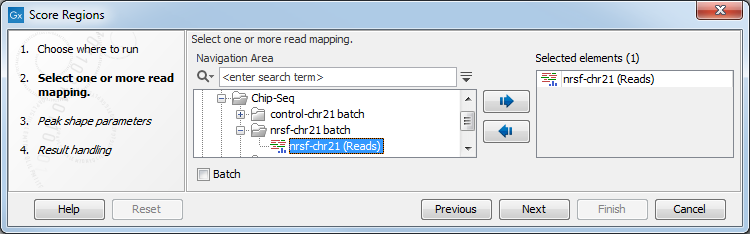
Figure 37.36: Select the input data for Score Regions.
Click Next to go to the next wizard step (shown in figure 37.37).
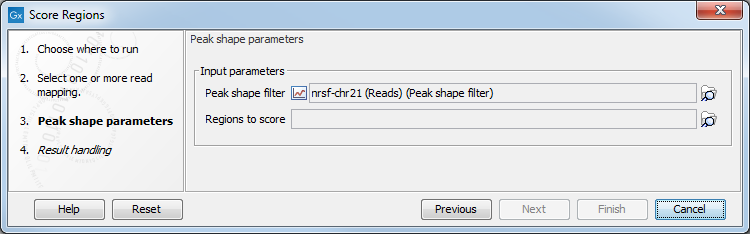
Figure 37.37: Options for Score Regions.
In this wizard step you have the following options:
- Peak shape filter The peak shape filter (
 ) to apply
to the data. Peak shape filters can be obtained as the result of the ChIP-Seq Analysis
tool.
) to apply
to the data. Peak shape filters can be obtained as the result of the ChIP-Seq Analysis
tool.
- Regions to score An annotation track (
 )
containing the regions where the peak shape will be applied. The peak shape filter will be applied to every genomic position
within the interval and the maximum values will be used to score the region.
)
containing the regions where the peak shape will be applied. The peak shape filter will be applied to every genomic position
within the interval and the maximum values will be used to score the region.
The result of the algorithm will be an annotation track (![]() )
of the same type as the regions to score annotation track, where the columns of
type Peak shape score, P-value and Center of peak will be added or replaced.
)
of the same type as the regions to score annotation track, where the columns of
type Peak shape score, P-value and Center of peak will be added or replaced.
After clicking Next, you can choose whether you want to open the result directly, or save the results in the Navigation Area. If you choose to save the results, you will be asked to specify where you would like to save them.