CNV results report
The report contains information about the results of the Copy Number Variant Detection (Targeted) tool.
Normalization The Normalization section gives information about the sample-level and chromosome-level coverages. Any chromosomes with disproportionate coverages are noted; targets on these chromosomes were ignored when setting up the statistical models.
Target-level log2-ratios The target-level coverage log2-ratios and predicted regional gains and losses are presented as a graph. Double click on it to see it in full view and access data points in a table.
An example is shown in figure 32.29. The following elements are included in the plots:
- Targets are plotted by genomic position (horizontal axis) and observed mean adjusted coverage log2-ratio (vertical axis). Targets are colored by their position relative to regional gains and losses. Red: The target is inside a predicted gain. Blue: The target in inside a predicted loss. Grey: The target is in a region with no predicted regional copy number change.
- Regional gains (red) and losses (blue) are plotted by genomic position (horizontal axis) and mean coverage log2-ratio (vertical axis).
- 95 % confidence intervals of the expected mean adjusted log2-ratios of coverages based on the statistical model are plotted as grey dotted lines.
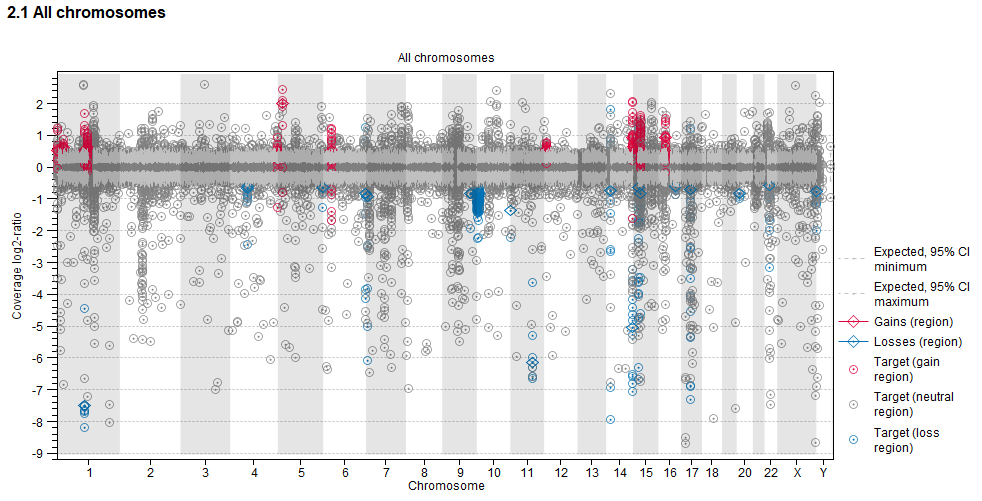
Figure 32.29: An example graph showing the mean adjusted log2-ratios of coverages in the report produced by the Copy Number Variant Detection (Targeted) tool. Targets located in regions where gains are predicted are red. Targets located in regions where losses are predicted are blue.
CNV statistics The last section in the report provides some information about the number of CNVs called in the region-level prediction results. If a gene track is provided as input, it also shows the number of genes affected by CNVs. It is possible for a gene to be affected by both a deletion and an amplification, if the gene overlap two different regions from the Region-level CNV results track. The number of uncalled or filtered regions are also shown.