Create Venn Diagram for RNA-Seq
The Create Venn Diagram tool makes it possible to compare the overlap of differentially expressed features, such as genes or transcripts, in two or more statistical comparisons. The features considered to be differentially expressed can be controlled by setting appropriate p-value and fold change thresholds.
Note that it is possible to create filtered Venn diagrams from existing ones - for example, showing only genes that are up-regulated in all statistical comparisons - by using the Create from selection button on the Venn diagram table view.
To create the Venn diagram:
Tools | RNA-Seq and Small RNA Analysis (![]() )| Differential Expression (
)| Differential Expression (![]() ) | Create Venn Diagram for RNA-Seq (
) | Create Venn Diagram for RNA-Seq (![]() )
)
Select a number of statistical comparison tracks (![]() ) or statistical comparison tables (
) or statistical comparison tables (![]() ) and click Next (see figure 34.92 and figure 34.93).
) and click Next (see figure 34.92 and figure 34.93).
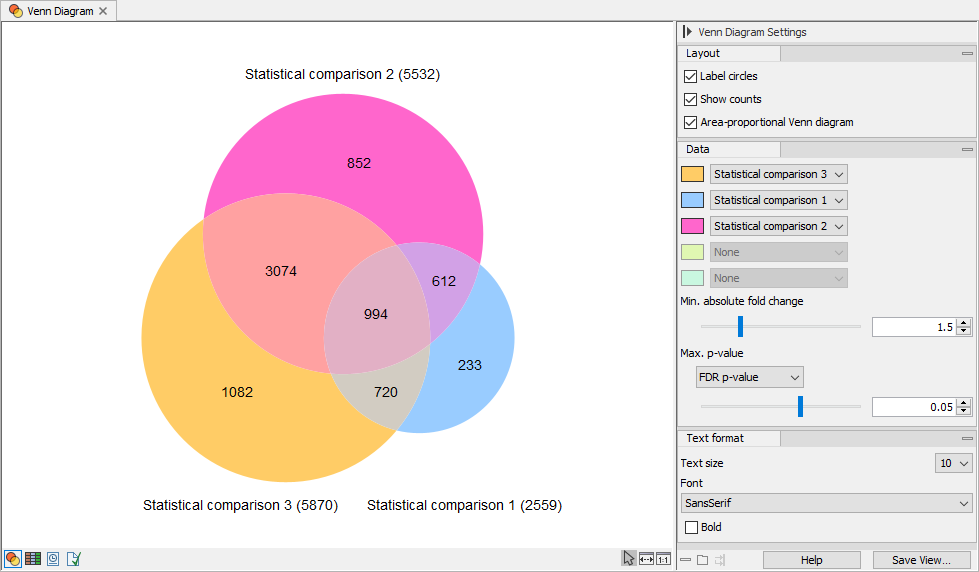
Figure 34.92: A Venn diagram with 3 groups. The circle sizes and overlaps are proportional to the number of overlapping features.
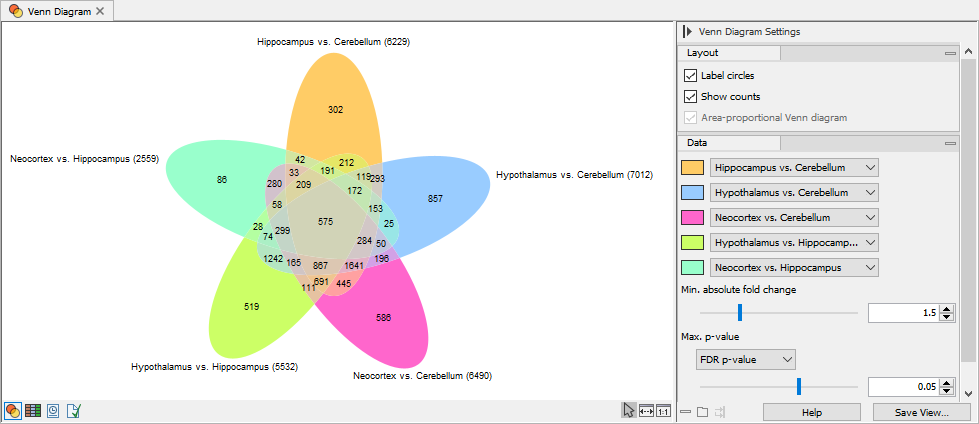
Figure 34.93: A Venn diagram with 5 groups.
In the Side Panel to the right, it is possible to adjust the Venn Diagram settings. Under Layout, you can adjust the general properties of the plot.
- Label circles Toggles the names of the statistical comparisons.
- Show counts Toggles the display of feature counts.
- Area-proportional Venn Diagram When selected, sizes and positions of the circles are adjusted in proportion to the number of overlapping features. This is only supported for Venn diagrams for two or three groups. Otherwise, ellipses are drawn with fixed positions and identical size.
The Data side panel group makes it possible to choose the differentially expressed features of interest. The set of statistical comparisons to be compared can be selected using the drop down menus at the top of the group. The color of a given statistical comparison can be customized using the color picker next to the drop down menu. Note that when comparing two or three samples at a time the circles behave dynamically while selection of four or five samples for comparison provides static visualizations.
- Min. absolute fold change Only features with an absolute fold change higher than the specified threshold are taken into account.
- Max. p-value Only features with a p-value less than the specified threshold will be taken into account. It is possible to select which p-value measure to use.
Finally, the Text format group makes it possible to adjust the settings for the count and statistical comparison labels.
Venn diagram table view
The p-values and fold changes for each feature can be inspected in the Venn diagram table view (see figure 34.94).
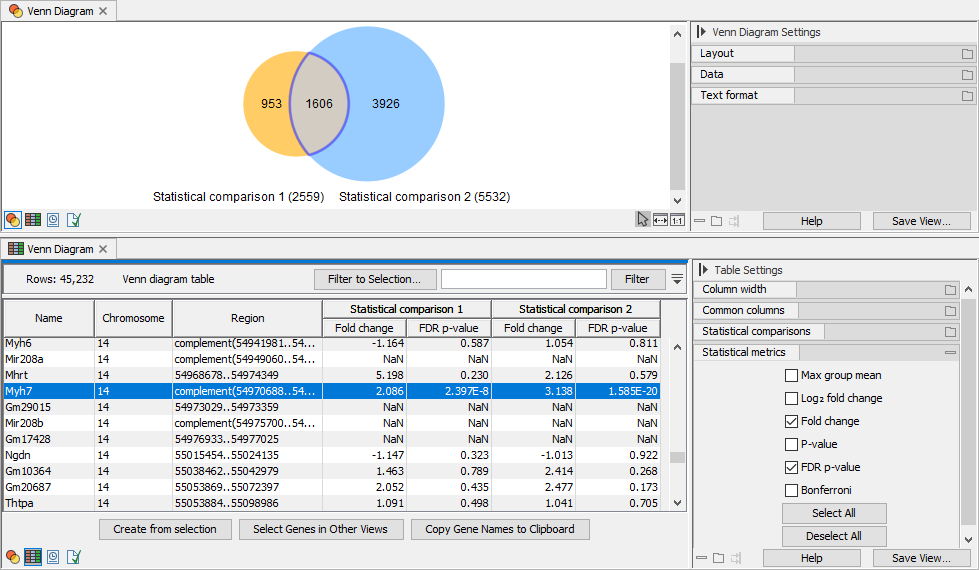
Figure 34.94: The Venn diagram table view.
Clicking a circle segment in the Venn Diagram plot will select the features in the table view. You can then use the "Filter to selection" button in the Table view to only see the selected rows. It is also possible to create a subset Venn diagram using the Create from selection button.
In the Side Panel to the right it is possible to adjust the column layout, and select which columns should be included in the table.