Create Report from Table
Create Report from Table takes as input any element that can be exported as "Tab delimited text" and generates a report containing a customizable table view of that element.
Filtering the input element before running the tool is recommended to reduce the number of rows and avoid generating long reports. Filtering can be done interactively from the table view or non-interactively using a filtering tool.
To run the tool, go to:
Tools | Utility Tools (![]() ) | Reports (
) | Reports (![]() ) | Create Report from Table (
) | Create Report from Table (![]() )
)
The following options can be configured (figure 38.28):
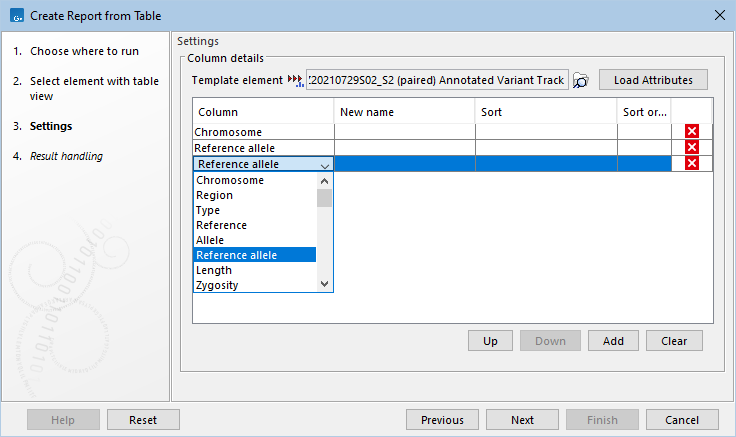
Figure 38.28: Options for creating a report from a sequence list table view. In this example, three columns are added to the report, the Size column is renamed to Length and is displayed only as a percentage, rows are sorted in descending order by Length and in ascending order by Name, and a Total summary row is included.
- Columns Columns from the input element to include in the output report.
- Column presentation Click the add (
 ) button to open the "Column presentation" dialog, where for each column included in the report, the following can be configured (figure 38.29):
- New name (Optional) The name to use for the column in the report. Shorter names are recommended. If not set, the original column name is used.
- Omit original column When checked, the original column values are omitted from the report. This option requires that Add % column is also checked.
- Add % column When checked, a new column is added to the report with "(%)" appended to the name, showing the input values as percentages, i.e. multiplied by 100 and divided by the total sum of all values in the table. Note that all rows in the input element are used for calculating totals, regardless of the Rows option.
If checked for columns without numerical values, or for columns containing negative numbers, the resulting percentage column will be empty.
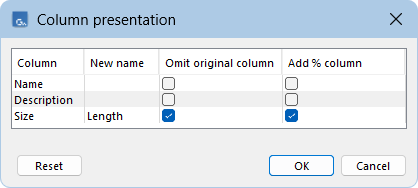
Figure 38.29: The "Column presentation" dialog allows renaming columns, omitting the original column, and including a percentage version of the column.
- New name (Optional) The name to use for the column in the report. Shorter names are recommended. If not set, the original column name is used.
- Rows Rows to include in the report:
- All rows Includes all rows from the input element.
- PASS rows If the input contains a "Filter" column, only rows with no value in this column, or with the value PASS, are included. If the "Filter" column is not present, this behaves as All rows.
- All rows Includes all rows from the input element.
- Row sorting Sorts rows in the report according to the selected columns, in the order they are chosen. Each column can be used for ascending (
 ) or descending (
 ) sorting. If a column has been renamed in Column presentation, its new name is used here.
- Summary rows For numerical columns, adds a row summarizing the included data. Available summary types are: Total, Minimum, Median, Maximum, Mean, and Standard deviation.
Summaries are calculated only from rows included in the report. As a result, the Total for a percentage column may be less than 100 when using the PASS rows option (figure 38.30).
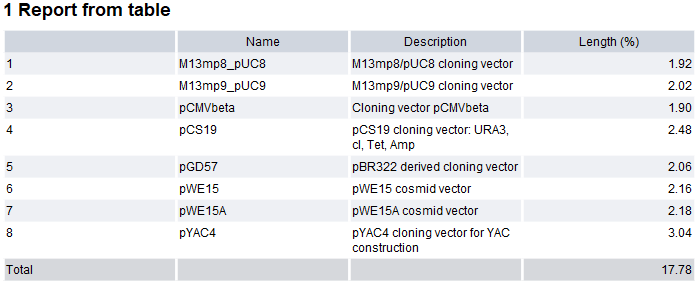
Figure 38.30: Output from Create Report from Table using "PASS rows" on a sequence list previously filtered with "Filter on Custom Criteria" and "Annotate". The "Total" for the "Length (%)" column is lower than 100.When summaries are included, rows are numbered in the first column of the table in the output report (figure 38.30).
The example shown in figure 38.30 illustrates the resulting report when using the options shown in figures 38.28.
The resulting report can then be used directly or included in a sample report or combined report.
- Note that only the Summary rows can be used to add quality control summary items in a sample report. If multiple numerical columns are present in the report, all summary values must satisfy the defined quality control conditions. Only the most extreme summary value relative to the used operator is listed in the report (for example, the smallest value when using ">" or ">=").
- Similarly, only Summary rows are included in a combined report, where all summaries are added if multiple numerical columns are available.