Protein charge
In CLC Genomics Workbench you can create a graph in the electric charge of a protein as a function of pH. This is particularly useful for finding the net charge of the protein at a given pH. This knowledge can be used e.g. in relation to isoelectric focusing on the first dimension of 2D-gel electrophoresis. The isoelectric point (pI) is found where the net charge of the protein is zero. The calculation of the protein charge does not include knowledge about any potential post-translational modifications the protein may have.
The pKa values reported in the literature may differ slightly, thus resulting in different looking graphs of the protein charge plot compared to other programs.
In order to calculate the protein charge:
Tools | Classical Sequence Analysis (![]() ) | Protein Analysis (
) | Protein Analysis (![]() )| Create
Protein Charge Plot (
)| Create
Protein Charge Plot (![]() )
)
This opens the dialog displayed in figure 21.1:
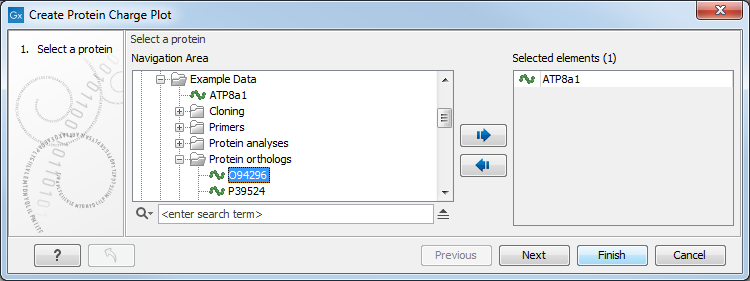
Figure 21.1: Choosing protein sequences to calculate protein charge.
If a sequence was selected before running the tool, the sequence will be listed in the Selected Elements pane of the dialog. Use the arrows to add or remove sequences or sequence lists from the selected elements.
You can perform the analysis on several protein sequences at a time. This will result in one output graph showing protein charge graphs for the individual proteins.
Click on Finish to launch the analysis.
Figure 21.2 shows the electrical charges for three proteins. In the Side Panel to the right, you can modify the layout of the graph.
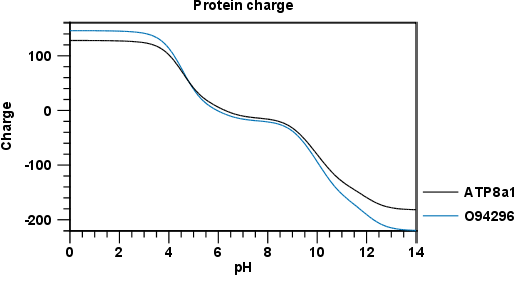
Figure 21.2: View of the protein charge.
See Graph preferences for information about the graph view.