ChIP-Seq Analysis
Chromatin immunoprecipitation followed by high-throughput sequencing (ChIP-Seq) is used to analyze the interactions of proteins with genomic DNA, enabling accurate mapping of global binding sites for any protein of interest when specific antibodies are available. After a cross-linking step that covalently links proteins and DNA, ChIP-Seq uses chromatin immunoprecipitation (ChIP) to isolate the relevant fragments of genomic DNA. Subsequent massively parallel DNA sequencing and mapping to a reference genome allow identification of binding sites for DNA-associated proteins. Bioinformatics analysis typically includes extraction of binding regions and pattern discovery to identify conserved DNA-binding motifs. Usually, a control experiment is performed in which the immunoprecipitation step is omitted. This control data is typically used to correct for sequencing biases, such as those occurring in less accessible genomic regions, repetitive regions, or copy number aberrations.
Peak finding is an essential post-processing step in the analysis and interpretation of ChIP-Seq data and many tools that have been developed specifically for this purpose.
Most peak callers are difficult to parametrize such that they accurately discriminate active and inactive promoter regions [Rye et al., 2011,Heydarian et al., 2014]. Nevertheless, these peaks are clearly visible to the human eye since they show a distinct shape. The ChIP-Seq Analysis tool takes a different approach, which is conceptually intuitive and modular by learning the shape of the signal from the data. The parametrization is done by giving positive and negative examples of peak shapes, making the parametrization process explicit and easily understandable.
The ChIP-Seq Analysis tool uses this approach to identify genomic regions with significantly enriched read coverage and a read distribution with a characteristic shape.
ChIP-Seq data analysis is typically based on identification of genomic regions where the signal (i.e. number of mapped reads) is significantly enriched. The detection of the enrichment is based on a background model or the comparison with a ChIP-Seq sample where the immunoprecipitation step is omitted. The shape of the signal from ChIP-Seq data depends on which protein was targeted in the immunopreciptation reaction [Stanton et al., 2013,Kumar et al., 2013]. For example, the typical signal shape of a transcription factor binding site like NRSF shows a high concentration of forward reads followed by a high concentration of reverse reads (figure 37.5).
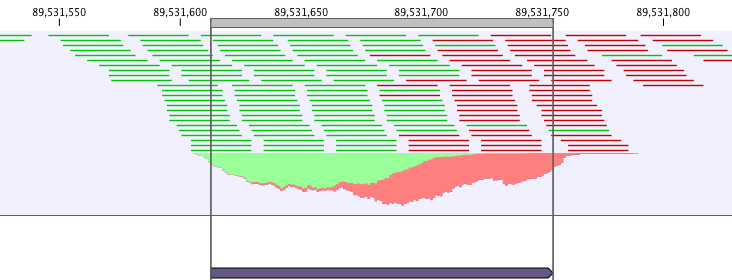
Figure 37.5: Distribution of forward (green) and reverse (red) reads around a binding site of the transcription factor NRSF.
The tool makes use of this characteristic shape to identify enriched regions (peaks) in ChIP-Seq data.
Subsections
- Quality Control of ChIP-Seq data
- Learning peak shapes
- Applying peak shape filters to call peaks
- Running the Transcription Factor ChIP-Seq tool
- Peak track