Create Sample Report output
A single report (![]() ) is generated, containing summary items and other selected information from the supported reports provided as input.
) is generated, containing summary items and other selected information from the supported reports provided as input.
The report contains one section per input report type, as described in Report types and sample report content. Summary items are displayed in table format.
The summary items are displayed in tables with two columns. The first row indicates the report from which the information has been extracted. The sample report contains links to the input reports and clicking on the report name selects the corresponding report in the Navigation Area.
Table cells are highlighted in pink if they are considered problematic: a potential problem has been identified that is explained underneath the table.
Summary section
By default, sample reports contain a summary section, offering a quick overview of the reports where potential problems have been identified. The summary section is only present if it was included when configuring the report content (see Specifying the content of the report) and it only contains summaries those sections/subsections/summary items that are also included in the combined report.
If summary items were added to the "Set QC" wizard step (figure 38.34), a "Quality control" subsection is added to the summary section. The summary items are displayed in a table with three columns: the selected summary item, its value, and the set threshold, if any. When conditions are set, the value is colored accordingly (figure 38.38). If multiple conditions are set for one summary item, the value is colored:
- Red if a condition with a red color is not met. Where all such conditions are met, then:
- Yellow if a condition with a yellow color is not met. Where all such conditions are met, then:
- Green, i.e. all conditions are fulfilled.
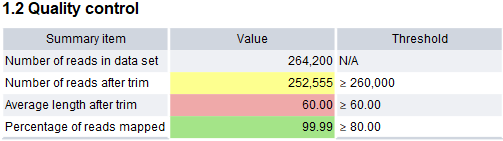
Figure 38.38: The "Quality control" subsection.
Note that rounding of values should be taken into account when interpreting results. For example, the extract in figure 38.38 is from a report generated using the configuration shown in figure 38.34. The Average length after trim is reported as 60.00, but is marked in red, even though the condition specified the value should be >= 60.00. The true value in the report was, in fact, 59.996. When necessary, the values without rounding can be checked by exporting the report to JSON format.
The sample report icon summarizes the overall status:
- The sample failed the quality check, because at least one red condition is not met (
 ). Where all such conditions are met, then:
- The quality of the sample is uncertain, because a yellow condition is not met (
 ). Where all such conditions are met, then:
- The sample passed the quality check, because all conditions are met (
 ). Or:
- No relevant quality control thresholds have been defined (
 ).
).