Output from Detect and Refine Fusion Genes
The tool produces the following outputs:
- Fusion genes, WT. An annotation track (
 ) with the fusion breakpoints relative to the wildtype (WT) reference genome. See Fusion tracks below for more details.
- Reads, WT. A reads track (
 ) with the input reads mapped to the WT reference genome after refinement.
- Unaligned ends, WT. A reads track () with the unaligned ends mapped to the WT reference genome. This can be useful in choosing optimal values for 'Minimum unaligned end count', 'Minimum length of unaligned ends', and 'Maximum distance to known exon boundary'.
- Fusion genes, fusions. An annotation track () with the candidate fusion breakpoints relative to the artificial fusion genome. See Fusion tracks below for more details.
- Reads, fusions. A reads track () with the input reads mapped to the artificial fusion genome after refinement.
- Reference (fusions). A sequence track (
 ) with the artificial fusion genome reference sequences.
- Genes (fusions). An annotation track () with the gene regions for the candidate fusions on the artificial fusion genome.
- mRNA (fusions). An annotation track () with the transcripts for the breakpoints of the candidate fusions on the artificial fusion genome.
- CDS (fusions). An annotation track () with the CDS regions for the breakpoints of the candidate fusions on the artificial fusion genome. This is produced only when a CDS track was provided as input.
- Primer (fusions). An annotation track () with the primer regions on the artificial fusion genome. This is produced only when a primer track was provided as input.
- Fusion genes report. A report (
 ) summarizing candidate fusions that have at least one breakpoint pair with a PASS status. See Detect and Refine Fusion Genes report below for more details.
Fusion tracks
The fusion annotation track outputs contain the fusion breakpoints. Fusions are named in the format 5' gene-3' gene. The table view (![]() ) shows one breakpoint per row. In addition to standard information, it contains the following:
) shows one breakpoint per row. In addition to standard information, it contains the following:
- Fusion plot. A link to the fusion plot. See Fusion plots below for more details.
- IPA gene view. A link to QIAGEN Ingenuity Pathway Analysis with additional information about the fusion, if available.
- Fusion number. A unique identifier for the breakpoints associated with the same gene pair. Fusions with the strongest statistical support (low p-value, high z-score) are assigned the lowest fusion number.
- Fusion pair. For each fusion number, a unique identifier for the corresponding breakpoint pairs.
- 5'/3' gene. The name of the 5'/3' gene.
- Breakpoint type. The position of the breakpoint: 5' if located in the 5' gene, or 3' if located in the 3' gene.
- Filter. If the breakpoint pair is assigned a PASS status, it is marked as such; otherwise, the reasons for not passing are provided. See Filtered fusions below for more details.
- P-value. The probability that the breakpoint pair occurred by chance, in the absence of an actual fusion.
- Calculated using a binomial test from the number of reads supporting the breakpoint pair and the total 5' and 3' read coverage using a binomial test.
- Both fusion crossing reads and fusion spanning reads are included.
- Z-score. Calculated from the p-value using the inverse distribution function for a standard Gaussian distribution.
- Fusion crossing reads and Fusion spanning reads. The number of reads supporting the breakpoint pair. Specifically:
- Fusion crossing reads are reads that map across the breakpoint.
- Fusion spanning reads are paired reads that map to both sides of the breakpoint but without crossing it. If paired reads span multiple breakpoints, the counts are distributed proportionally to the number of fusion crossing reads.
- Fusion supporting reads are the total number of fusion crossing and fusion spanning reads.
- 5'/3' read coverage and 5'/3' spanning read coverage. The number of reads mapping in the vicinity of the breakpoint pair. Specifically:
- Read coverage consists of reads that map on the reference genome across the breakpoint, in addition to the fusion crossing reads, as described above.
- Spanning read coverage consists of paired reads that map on the reference genome on both sides of the breakpoint but without crossing it, in addition to the fusion spanning reads, as described above. If paired reads span multiple breakpoints, the counts are distributed proportionally to the read coverage.
- Frequency. The percentage of reads supporting the breakpoint pair.
- Calculated from the number of reads supporting the breakpoint pair and the total 5' and 3' read coverage.
- Both fusion crossing reads and fusion spanning reads are included.
- 5'/3' frequency. The percentage of reads supporting the 5'/3' breakpoint.
- Calculated from the number of reads supporting the 5'/3' breakpoint and the 5'/3' read coverage.
- Both fusion crossing reads and fusion spanning reads are included.
- Translocation name.
The fusion description in COSMIC format. The transcript with the highest priority (or the first in the list) is used.
This is present only when an mRNA track was provided as input.
- Compatible transcripts. All transcripts from the input mRNA track that have an exon boundary within 'Maximum distance to known exon boundary' from the breakpoint. For novel exon boundaries, a name such as '10-gene27693-32015547-BEGINNING-0' is provided, indicating that the breakpoint at position 32015547 is associated with gene27693 on chromosome 10, near the start of an existing exon. The final '0' is a counter.
- Exon skipping. Indicates whether the fusion involves a single gene, corresponding to transcripts that have exons missing compared to the WT transcript annotation.
- Novel exon boundaries. Indicates whether one or both fusion breakpoints are at a novel exon boundary.
- Found in-frame CDS. Indicates if at least one of the fusion CDSs is in-frame. The fusion CDS refers to the resulting coding sequence of the fusion gene; it is considered in-frame if its length is divisible by 3. Complex factors such as frameshift mutations or stop codons from variants near the breakpoints are disregarded.
This is present only when a CDS track was provided as input.
- Breakpoint distance. The physical distance between the breakpoints when on the same chromosome, otherwise -1. If the distance is small (e.g., <200,000), the fusion may be a false positive due to readthrough transcription.
- Original chromosome and Original region. Only present in tracks based on the artificial fusion genome.
Filtered fusions
The 'Filter' column contains the reasons why breakpoint pairs were not assigned a PASS status.
Breakpoint pairs for candidate fusions selected during filtering contain Filtered during refinement, and at least one of the following:
- Few supporting reads. The pair did not meet the 'Minimum number of supporting reads' threshold.
- No support. The pair was not supported by any read.
- High p-value. The pair exceeded the 'Maximum p-value' threshold.
- Low Z-score. The pair did not meet the 'Minimum Z-score' threshold.
If 'Include all fusions in the WT track output' was checked, the 'Fusion genes, WT' track additionally contains the detected potential fusions that were not selected as candidate fusions during filtering. These fusions contain Filtered before refinement, and at least one of the following:
- Excluded by fusion filter (<table name>), Excluded by fusion filter (names), or Not included by fusion filter. The fusion was:
- Excluded based on a table named '<table name>' provided in 'Fusions for filtering (tables)'.
- Excluded based on 'Fusions for filtering (names)'.
- Not included based on either a table provided in 'Fusions for filtering (tables)' or 'Fusions for filtering (names)'.
- No fusion crossing reads. Due to the absence of fusion crossing reads, the precise breakpoint location could not be identified. However, the fusion was supported by paired reads that mapped as broken pairs. For such fusions, the breakpoint region and 5'/3' gene are ill-defined:
- The breakpoint 'Region' encompasses the entire region of the 5'/3' gene.
- The 5' gene is the one that the first read in the pair maps to, if the read is mapped in the direction of the gene. Otherwise, the 5' gene is the one that the second read maps to.
- Too few unaligned ends. The fusion did not meet the 'Minimum unaligned end count' threshold.
- Exceeds number of breakpoints. The fusion was excluded due to the limitation of 20 breakpoint pairs between the same two genes.
- Exceeds promiscuity threshold. The fusion exceeded the 'Promiscuity threshold'.
- Exceeds number of fusions. The fusion exceeded the 'Maximum number of fusions' threshold.
Fusion plots
The fusion plot displays identified breakpoint pairs between one 5' and one 3' transcript for a given candidate fusion (figure 34.60). Only the breakpoint pairs compatible with the selected 5' and 3' transcripts are shown.
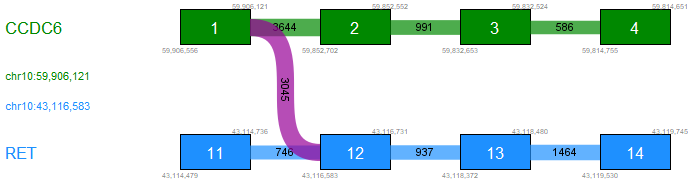
Figure 34.60: Fusion plot showing a fusion between exon 1 of CCDC6 and exon 12 of RET.
The 5' and 3' transcripts in the plot are selected as follows:
- They have an exon boundary at the breakpoint with the highest number of fusion crossing/spanning reads. If there are multiple such transcripts:
- They have the most exons with boundaries at breakpoints (i.e., the most purple connections). If there are multiple such transcripts:
- They have the highest number of fusion crossing/spanning reads summed across the breakpoints.
The plot contains the following types of elements:
- Green box. An exon in the 5' transcript.
- Blue box. An exon in the 3' transcript.
- Gray box. An exon that is not in the selected transcript. The exon may be present in other transcripts, or may represent a novel exon.
- Purple connection. Fusion crossing/spanning reads supporting the fusion.
- Green/blue connection. Reads supporting the WT 5'/3' transcript.
- Gray connection. Reads supporting alternative splicing.
- White vertical line within green or blue box. Novel exon boundary.
Detect and Refine Fusion Genes report
The report has the following sections:
- Summary. Contains a table with the sample name.
- Unaligned ends. Summarizes the number of unaligned ends used to detect fusions:
- Unaligned ends. Number of identified unaligned ends.
- Mapped unaligned ends. Number of unaligned ends that could be mapped.
- Unmapped unaligned ends. Number of unaligned ends that could not be mapped.
- Discarded breakpoints. Number of discarded breakpoints. When breakpoints are adjacent because of two overlapping transcripts, one of the breakpoints is discarded.
- Fusions. Provides details for all candidate fusions that have at least one breakpoint pair with a PASS status (figure 34.61): an overview of the most supported breakpoint pair, a summary for up to 10 breakpoint pairs, sorted by support, and the fusion plot (see Fusion plots above).
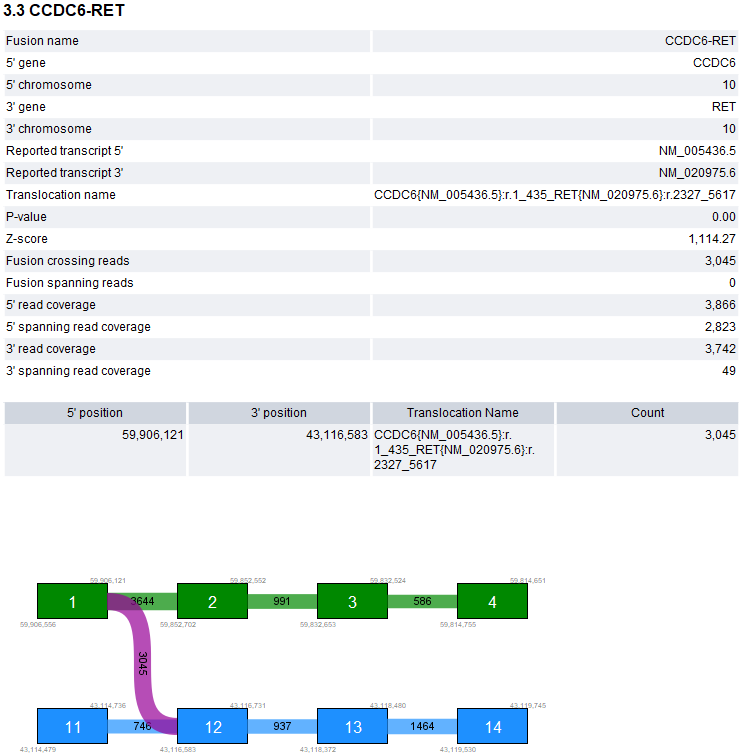
Figure 34.61: Example of a candidate fusion in the 'Fusions' section of the report.