Interpretation of fusion results
To evaluate the support for identified candidate fusions, the following outputs produced by the tool (see Output from Detect and Refine Fusion Genes) are most useful:
- The Fusion genes, fusions track.
- The Reads, fusions track.
- The Fusion plots.
Key aspects when evaluating the fusions are:
- Reads should map uniquely across the fusion breakpoints
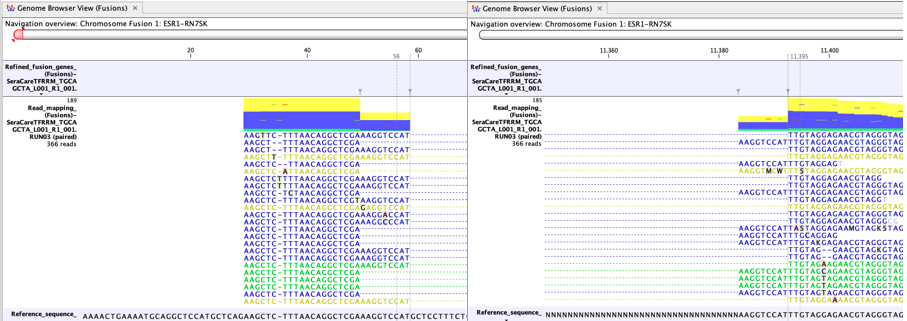
A high proportion of yellow reads mapping to the artificial fusion chromosome may indicate a false positive fusion (figure 33.62). Reads are yellow if they are not uniquely mapped and such reads are excluded when counting fusion supporting reads.

Figure 33.62: An example of a possible false positive fusion with many yellow reads. - There should be no sign of incomplete poly-A trimming
A high proportion of A-rich reads may indicate a false positive fusion (figure 33.63). Incomplete poly-A trimming can lead to reads with normal complexity on one side of the breakpoint and A-rich reads on the other side.

Figure 33.63: An example of a false positive fusion caused by incomplete poly-A trimming. - Fusions involving insertion of intronic sequences should be well supported
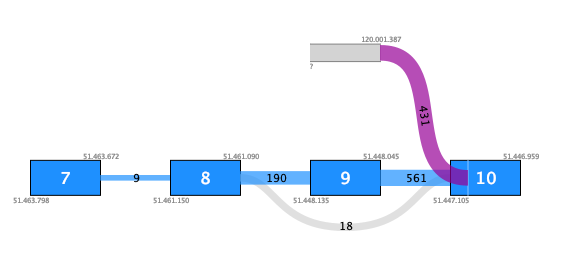
Fusions that involve insertion of intronic sequences may be false positives, especially if they have poor support. Insertion of an intronic sequence appears as a 'novel exon' indicated with a gray box in the fusion plot. Figure 33.64 shows an example of a possible false positive fusion where the novel exon has no support apart from the fusion crossing reads. Although there are 431 such reads, they do not fuse into a known exon boundary, but instead into the middle of an exon (white vertical line).

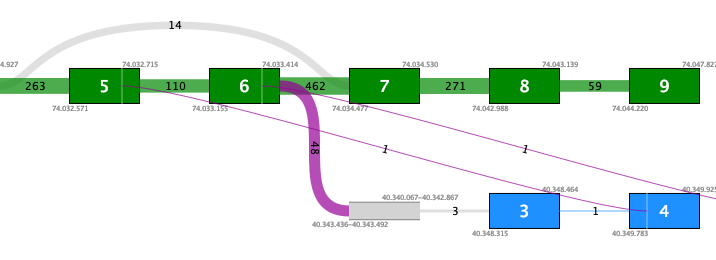
Figure 33.64: An example of a possible false positive fusion where the insertion of an intronic sequence is only supported by fusion crossing reads that are not at a known exon boundary.In contrast, figure 33.65 shows a true positive fusion that is supported by 48 fusion crossing reads, where the novel exon is supported by an additional 3 reads splicing into a known exon.

Figure 33.65: An example of a true positive fusion where the insertion of an intronic sequence is supported by reads other than fusion crossing reads.
