De novo assembly report
In the last dialog of the de novo assembly, you can choose to create a report of the results (see
figure 29.22).
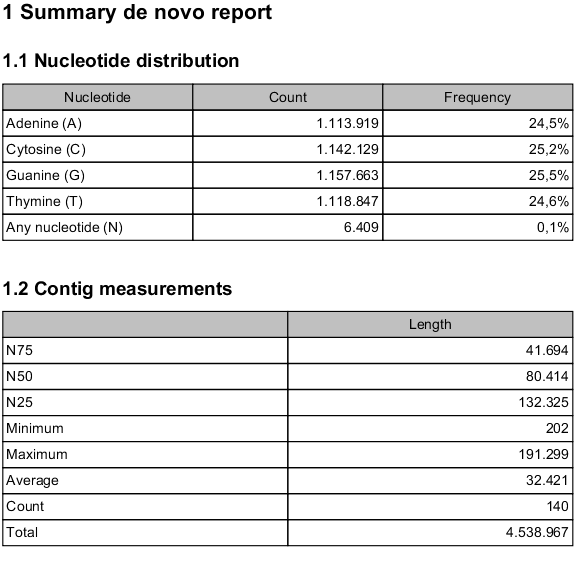
Figure 29.22: Creating a de novo assembly report.
The report contains the following information when both scaffolding and read mapping is performed:
- Nucleotide distribution
- . This includes Ns when scaffolding has been performed.
- Contig measurements
- . This section includes statistics about the number and lengths of contigs. When scaffolding is performed and the update contigs option is not selected, there will be two separate sections with these numbers: one including the scaffold regions with Ns and one without these regions.
- N25, N50 and N75
- . The N25 contig set is calculated by summarizing the lengths of the biggest contigs until you reach 25 % of the total contig length. The minimum contig length in this set is the number that is usually used to report the N25 value of a de novo assembly. The same goes with N50 and N75 which are the 50 % and 75 % of the total contig length, respectively.
- Minimum, maximum and average
- . This refers to the contig lengths.
- Count
- The total number of contigs.
- Total
- The number of bases in the result. This can be used for comparison with the estimated genome size to evaluate how much of the genome sequence is included in the assembly.
- Contig length distribution
- . A graph showing the number of contigs of different lengths.
- Accumulated contig lengths
- . This shows the summarized contig length on the y axis and the number of contigs on the x axis, with the biggest contigs ranked first. This answers the question: how many contigs are needed to cover e.g. half of the genome.
- Mapping information
- . The rest of the sections provide statistics from the read mapping (if performed). These are explained in Summary mapping report.