Zooming and navigating track views
Zooming in and out on the view shown in 24.1 is done either through the zoom tools in the right-hand corner of the Toolbar, using the+ and - keys on the keyboard or by using a mouse scroll wheel or gesture while pressing the Ctrl (When zooming in and out you will see that the data is visualized in an aggregated format using a density bar plot or graph when zoomed out. This allows you to navigate the view more smoothly and get an overview of e.g. how many SNPs that are located in a certain region.
In figure 24.2 we have zoomed in on a specific region, and you can see that the read track at the top is now showing the individual reads and the CDS and SNP annotations are shown in full detail as well.
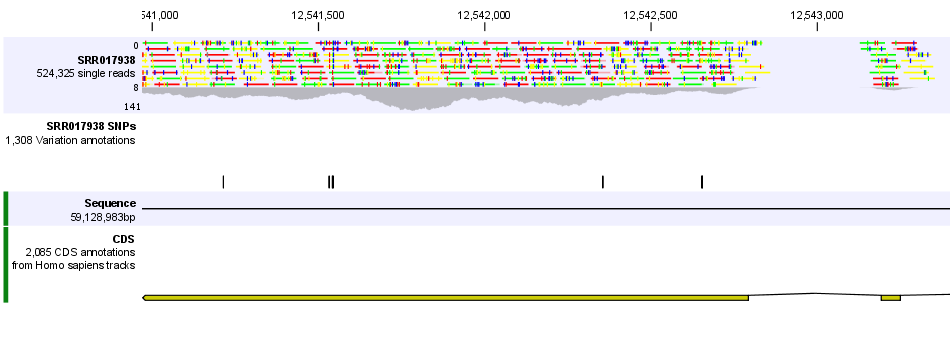
Figure 24.2: Zooming in reveals more detail on each track
Zooming in even further will also display the alignment of the reads so you can see the reference sequence and the reads at a nucleotide-level resolution (see figure 24.3).
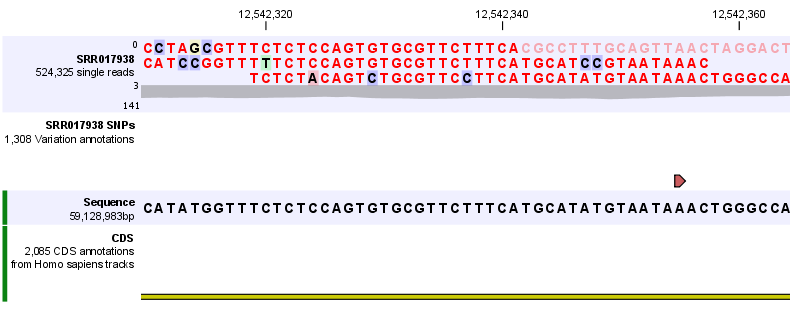
Figure 24.3: Zooming all the way in shows the actual bases of the reads and the reference sequence.
In this case, we can only see three reads so it makes sense to adjust the height of the reads track. This is done by simply dragging with the mouse at the bottom of the track. In that way you can see more reads as shown in figure 24.4.
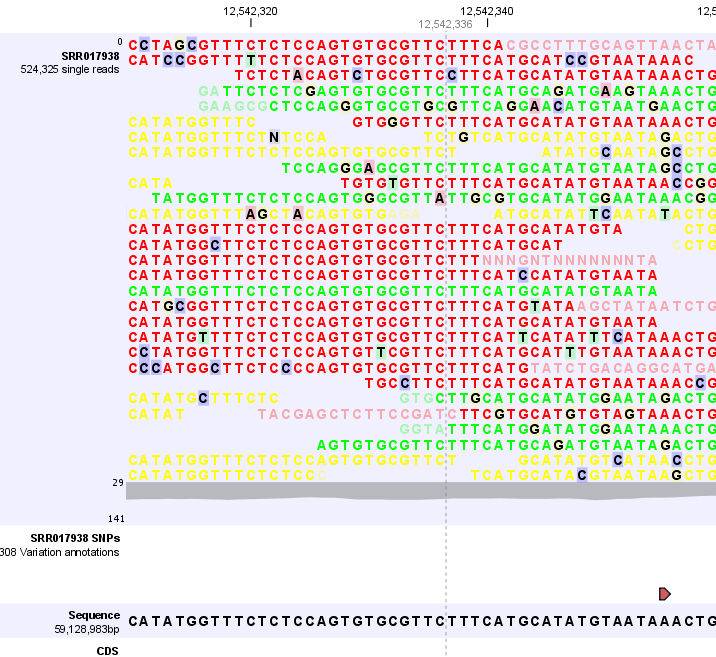
Figure 24.4: Adjusting the height of the track.
At any time, you can see the current location at the top of the Side Panel under Navigation. At the top you can see the chromosome currently shown, and below you can see start and end positions of the current view on the chromosome. You can jump to a different chromosome in the drop-down list, and you can jump to a new position by typing into the start and end text fields and wither wait 1 second or press Enter.
In the Side Panel you can adjust when the information in the track should be aggregated or when it should be displayed in detail under Track layout. Figure 24.5 shows the options for a read track and an annotation track.
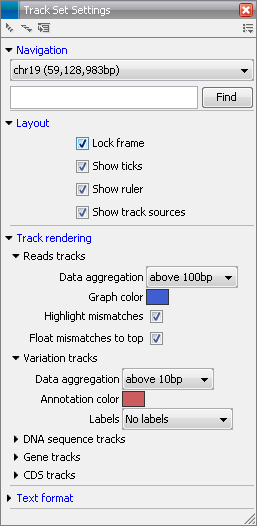
Figure 24.5: The Side Panel makes it possible to adjust the aggregation level.
The aggregation setting can be adjusted: with a low value the details will only be visible when zoomed in, and a high value means that you can see details even when zoomed out. Please note that if you choose a high value, it will take longer time to display the data on the screen.