Scatter plot view of an experiment
At the bottom of the experiment table, you can switch between different views of the experiment (see figure 27.59).
Figure 27.59: An experiment can be viewed in several ways.
One of the views is the Scatter Plot (![]() ). The scatter plot can be adjusted to show e.g. the group means for two groups (see more about how to adjust this below).
). The scatter plot can be adjusted to show e.g. the group means for two groups (see more about how to adjust this below).
An example of a scatter plot is shown in figure 27.60.
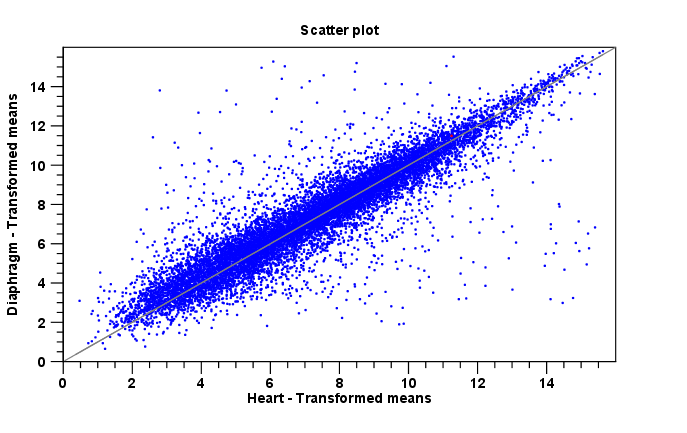
Figure 27.60: A scatter plot of group means for two groups (transformed expression values).
In the Side Panel to the left, there are a number of options to adjust this view. Under Graph preferences, you can adjust the general properties of the scatter plot:
- Lock axes. This will always show the axes even though the plot is zoomed to a detailed level.
- Frame. Shows a frame around the graph.
- Show legends. Shows the data legends.
- Tick type. Determine whether tick lines should be shown outside or inside the frame.
- Outside
- Inside
- Tick lines at. Choosing Major ticks will show a grid behind the graph.
- None
- Major ticks
- Horizontal axis range. Sets the range of the horizontal axis (x axis). Enter a value in Min and Max, and press Enter. This will update the view. If you wait a few seconds without pressing Enter, the view will also be updated.
- Vertical axis range. Sets the range of the vertical axis (y axis). Enter a value in Min and Max, and press Enter. This will update the view. If you wait a few seconds without pressing Enter, the view will also be updated.
- Draw x = y axis. This will draw a diagonal line across the plot. This line is shown per default.
- Line width
- Thin
- Medium
- Wide
- Line type
- None
- Line
- Long dash
- Short dash
- Line color. Allows you to choose between many different colors. Click the color box to select a color.
Below the general preferences, you find the Dot properties preferences, where you can adjust coloring and appearance of the dots:
- Dot type
- None
- Cross
- Plus
- Square
- Diamond
- Circle
- Triangle
- Reverse triangle
- Dot
- Dot color. Allows you to choose between many different colors. Click the color box to select a color.
Finally, the group at the bottom - Columns to compare - is where you choose the values to be plotted. Per default for a two-group experiment, the group means are used.
Note that if you wish to use the same settings next time you open a scatter plot, you need to save the settings of the Side Panel.