Bioinformatics explained: Sequence logo
In
the search for homologous sequences, researchers are often
interested in conserved sites/residues or positions in a sequence
which tend to differ a lot. Most researches use alignments (see
Bioinformatics explained: multiple alignments) for visualization of
homology on a given set of either DNA or protein sequences. In
proteins, active sites in a given protein family are often highly
conserved. Thus, in an alignment these positions (which are not
necessarily located in proximity) are fully or nearly fully
conserved. On the other hand, antigen binding sites in the F
In DNA, promoter sites or other DNA binding sites are highly conserved (see figure 20.8). This is also the case for repressor sites as seen for the Cro repressor of bacteriophage ![]() .
.
When aligning such sequences, regardless of whether they are highly variable or highly conserved at specific sites, it is very difficult to generate a consensus sequence which covers the actual variability of a given position. In order to better understand the information content or significance of certain positions, a sequence logo can be used. The sequence logo displays the information content of all positions in an alignment as residues or nucleotides stacked on top of each other (see figure 20.8). The sequence logo provides a far more detailed view of the entire alignment than a simple consensus sequence. Sequence logos can aid to identify protein binding sites on DNA sequences and can also aid to identify conserved residues in aligned domains of protein sequences and a wide range of other applications.
Each position of the alignment and consequently the sequence logo shows the sequence information in a computed score based on Shannon entropy [Schneider and Stephens, 1990]. The height of the individual letters represent the sequence information content in that particular position of the alignment.
A sequence logo is a much better visualization tool than a simple consensus sequence. An example hereof is an alignment where in one position a particular residue is found in 70% of the sequences. If a consensus sequence is used, it typically only displays the single residue with 70% coverage. In figure 20.8 an un-gapped alignment of 11 E. coli start codons including flanking regions are shown. In this example, a consensus sequence would only display ATG as the start codon in position 1, but when looking at the sequence logo it is seen that a GTG is also allowed as a start codon.
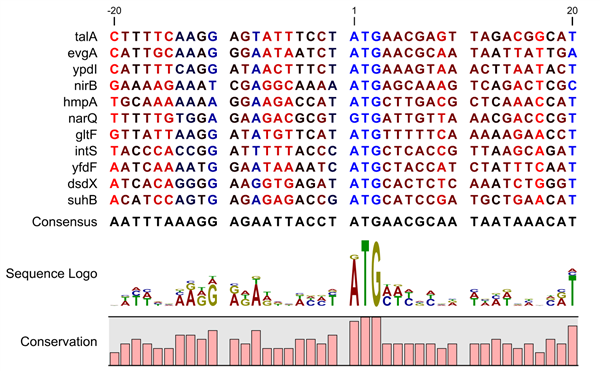
Figure 20.8: Ungapped sequence alignment of eleven E. coli sequences
defining a start codon. The start codons start at position 1. Below the alignment
is shown the corresponding sequence logo. As seen, a GTG start codon and the usual
ATG start codons are present in the alignment. This can also be visualized in the
logo at position 1.
Subsections