Running the target regions statistics
To create the target regions statistics:
Toolbox | Resequencing (![]() ) | Create Statistics for Target Regions (
) | Create Statistics for Target Regions (![]() )
)
This opens a dialog where you select mapping results mapping results (![]() )/ (
)/ (![]() )/ (
)/ (![]() ) and click Next. This opens the dialog shown in figure 26.1.
) and click Next. This opens the dialog shown in figure 26.1.
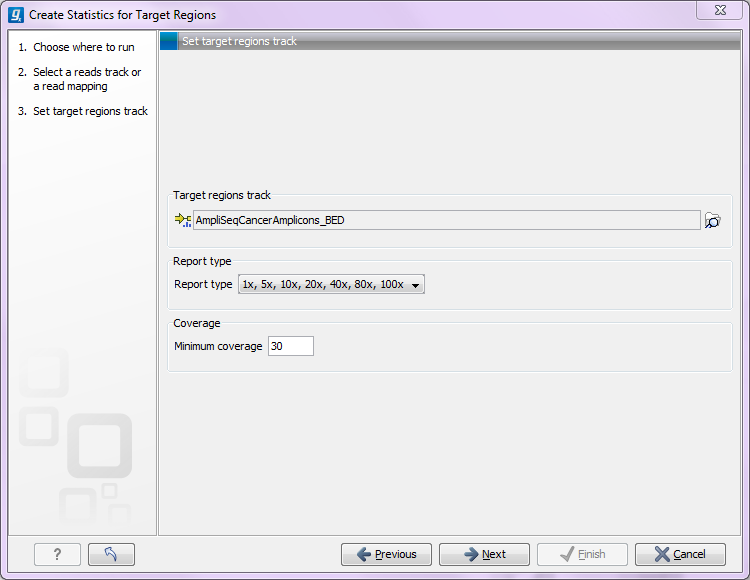
Figure 26.1: Specifying the track of target regions.
Click the Browse (![]() ) icon to select an annotation track that defines the targeted regions of your reference genome. You can either import the target regions as an annotation file or convert from annotations on a reference genome that is already stored in the Navigation Area.
) icon to select an annotation track that defines the targeted regions of your reference genome. You can either import the target regions as an annotation file or convert from annotations on a reference genome that is already stored in the Navigation Area.
The Report type allows you to select different sets of predefined coverage thresholds to use for reporting (see below). Furthermore, you will be asked to provide a Minimum coverage threshold. This will be used to provide the length of each target region that has at least this coverage.
Click Next to specify which kind of output you want (see figure 26.2).
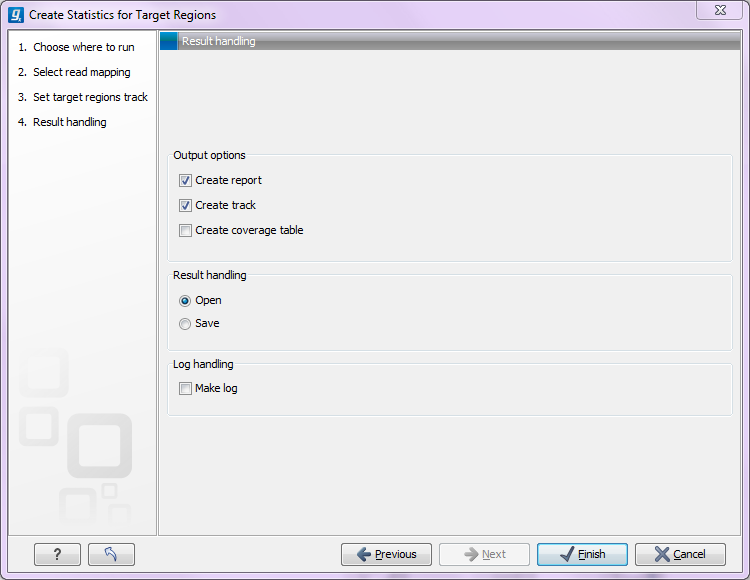
Figure 26.2: Specifying how the result should be reported.
There are three options:
- The report gives an overview of the whole data set as explained in Coverage summary report.
- The track gives information on coverage for each target region as described in Per-region statistics.
- The coverage table outputs coverage for each position in all the targets as described in Coverage table.