Create dot plots
A dot plot is a simple, yet intuitive way of comparing two sequences, either DNA or protein, and is probably the oldest way of comparing two sequences [Maizel and Lenk, 1981]. A dot plot is a 2 dimensional matrix where each axis of the plot represents one sequence. By sliding a fixed size window over the sequences and making a sequence match by a dot in the matrix, a diagonal line will emerge if two identical (or very homologous) sequences are plotted against each other. Dot plots can also be used to visually inspect sequences for direct or inverted repeats or regions with low sequence complexity. Various smoothing algorithms can be applied to the dot plot calculation to avoid noisy background of the plot. Moreover, can various substitution matrices be applied in order to take the evolutionary distance of the two sequences into account.
To create a dot plot:
Toolbox | Classical Sequence Analysis (![]() ) | General Sequence Analysis (
) | General Sequence Analysis (![]() )| Create Dot
Plot (
)| Create Dot
Plot (![]() )
)
or Select one or two sequences in the Navigation Area
| Toolbox in the Menu Bar | Classical Sequence Analysis (![]() ) | General Sequence Analysis (
) | General Sequence Analysis (![]() )| Create Dot Plot (
)| Create Dot Plot (![]() )
)
or Select one or two sequences in the Navigation Area
| right-click in the Navigation Area | Toolbox |
Classical Sequence Analysis (![]() ) | General Sequence Analysis (
) | General Sequence Analysis (![]() )|
Create Dot Plot (
)|
Create Dot Plot (![]() )
)
This opens the dialog shown in figure 14.3.
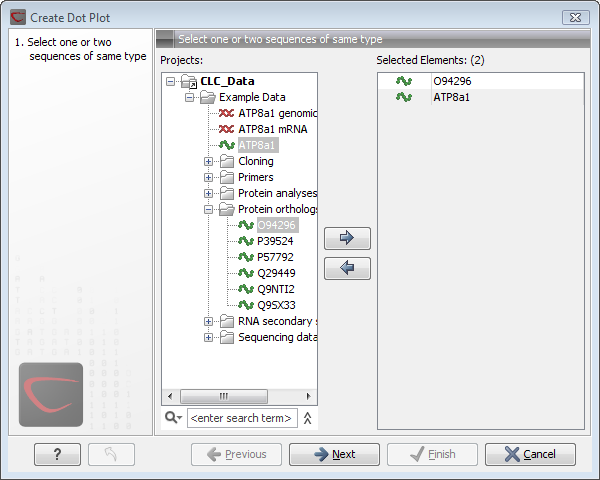
Figure 14.3: Selecting sequences for the dot plot.
If a sequence was selected before choosing the Toolbox action, this sequence is now listed in the Selected Elements window of the dialog. Use the arrows to add or remove elements from the selected elements. Click Next to adjust dot plot parameters. Clicking Next opens the dialog shown in figure 14.4.
Notice! Calculating dot plots take up a considerable amount of memory in the computer. Therefore, you see a warning if the sum of the number of nucleotides/amino acids in the sequences is higher than 8000. If you insist on calculating a dot plot with more residues the Workbench may shut down, allowing you to save your work first. However, this depends on your computer's memory configuration.
Subsections