Fisher exact test
This tool should be used if you have a case-control study. This could be patients with a disease (case) and healthy individuals (control). The idea is to identify variants which are more common in the case samples than in the control samples.
Toolbox | Resequencing (![]() ) | Compare Variants | Fisher Exact Test
) | Compare Variants | Fisher Exact Test
In the first step of the dialog, you select the case variant tracks. Clicking Next shows the dialog in figure 26.25.
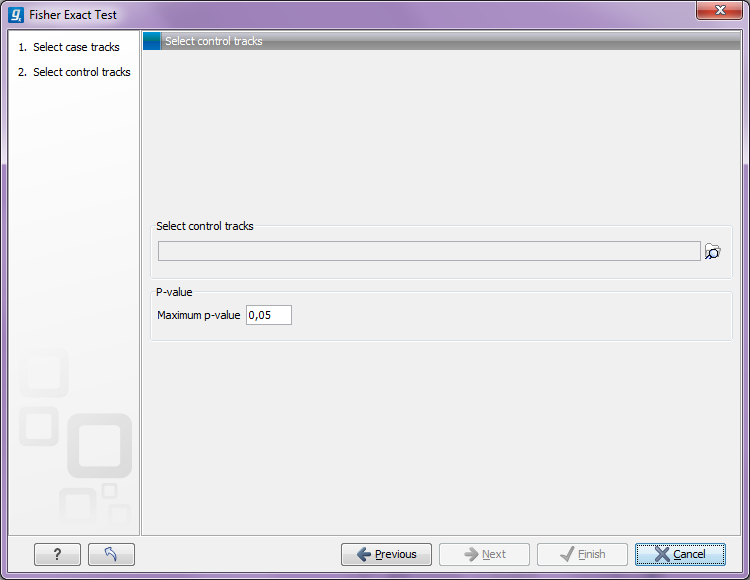
Figure 26.25: The fisher exact test settings.
A the top, select the variant tracks from the control group. Furthermore, you have to set a threshold for the p-value (default is 0.05). Only variants having a p-value below this threshold will be reported.
Each allele from each variant is considered separately. The Fisher exact test is applied on the number of occurrences of each variant/allele in the case and the control data set. variants with a low p-value are potential candidates for variants playing a role in the disease/phenotype. Please note that a low p-value can only be reached if the number of samples in the data set is high.