RNA-Seq analysis
Based on an annotated reference genome and mRNA sequencing reads, the CLC Genomics Workbench is able to calculate gene expression levels as well as discover novel exons. The key annotation types for RNA-Seq analysis of eukaryotes are of type gene and type mRNA. For prokaryotes, annotations of type gene are considered.
The approach taken by the CLC Genomics Workbench is based on [Mortazavi et al., 2008].
The RNA-Seq analysis is done in several steps: First, all genes are extracted from the reference genome (using annotations of type gene). Other annotations on the gene sequences are preserved (e.g. CDS information about coding sequences etc). Next, all annotated transcripts (using annotations of type mRNA) are extracted. If there are several annotated splice variants, they are all extracted. Note that the mRNA annotation type is used for extracting the exon-exon boundaries.
An example is shown in figure 27.1.
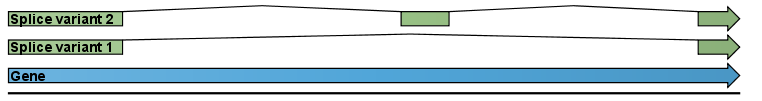
Figure 27.1: A simple gene with three exons and two splice variants.
This is a simple gene with three exons and two splice variants. The transcripts are extracted as shown in figure 27.2.
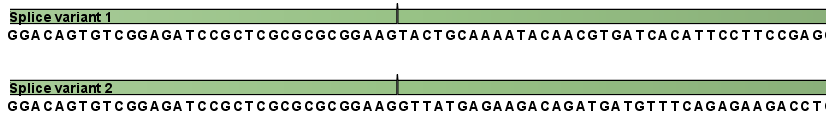
Figure 27.2: All the exon-exon junctions are joined in the extracted transcript.
Next, the reads are mapped against all the transcripts plus the entire gene (see figure 27.3).
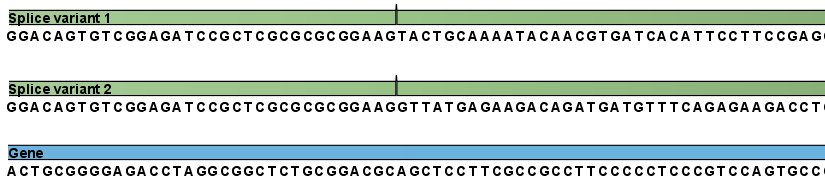
Figure 27.3: The reference for mapping: all the exon-exon junctions and the gene.
From this mapping, the reads are categorized and assigned to the genes (elaborated later in this section), and expression values for each gene and each transcript are calculated. After that, putative exons are identified.
Details on the process are elaborated below when describing the user interface. To start the RNA-Seq analysis analysis:
Toolbox | Transcriptomics Analysis (![]() ) | RNA-Seq Analysis (
) | RNA-Seq Analysis (![]() )
)
This opens a dialog where you select the sequencing reads (not the reference genome or transcriptome). The sequencing data should be imported as described in Import Sequencing Data.
If you have several different samples that you wish to measure independently and compare afterwards, you should run the analysis in batch mode.
Click Next when the sequencing data is listed in the right-hand side of the dialog.
Subsections
- Defining reference genome and mapping settings
- Exon identification and discovery
- RNA-Seq output options
- Interpreting the RNA-Seq analysis result