Detailed mapping report
To create a detailed mapping report:
Toolbox | NGS Core Tools (![]() ) | Create Detailed Mapping Report (
) | Create Detailed Mapping Report (![]() )
)
This opens a dialog where you can select mapping results (![]() )/ (
)/ (![]() )/ (
)/ (![]() ) or RNA-Seq analysis results (
) or RNA-Seq analysis results (![]() ).
).
Clicking Next will display the dialog shown in figure 25.5
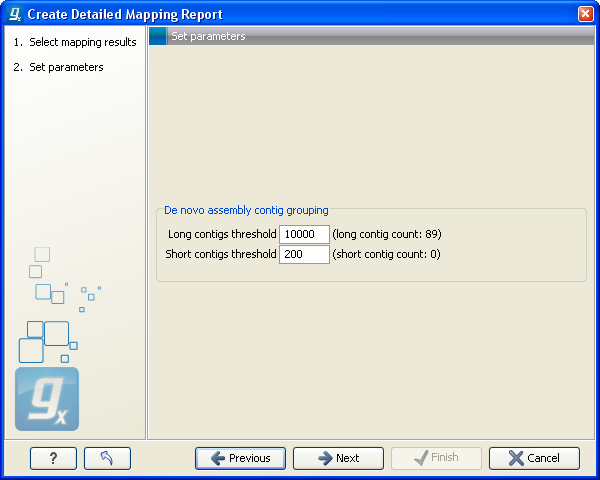
Figure 25.5: Parameters for mapping reports.
The first option is to set thresholds for grouping long and short contigs. The grouping is used to show statistics like number of contigs, mean length etc for the contigs in each group. This is only relevant for de novo assemblies. Note that the de novo assembly in the CLC Genomics Workbench per default only reports contigs longer than 200 bp (this can be changed when running the assembly).
Click Next to select output options as shown in figure 25.6
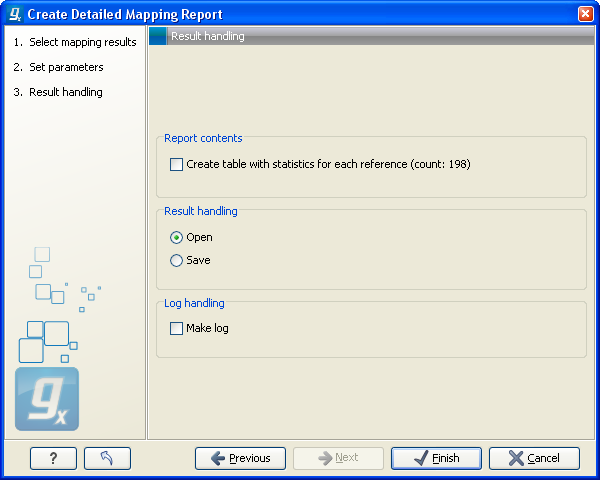
Figure 25.6: Optionally create a table with detailed statistics per reference.
Per default, an overall report will be created as described below. In addition, by checking Create table with statistics for each reference you can create a table showing detailed statistics for each reference sequence (for de novo results the contigs act as reference sequences, so it will be one row per contig). The following sections describe the information produced.
Subsections
- Reference sequence statistics
- Contig statistics for de novo assembly
- Read statistics
- Quality and mismatches