Sequence statistics
CLC Genomics Workbench can produce an output with many relevant statistics for protein sequences. Some of the statistics are also relevant to produce for DNA sequences. Therefore, this section deals with both types of statistics. The required steps for producing the statistics are the same.
To create a statistic for the sequence, do the following:
select sequence(s) | Toolbox in the Menu Bar |
Classical Sequence Analysis (![]() ) | General Sequence Analysis (
) | General Sequence Analysis (![]() )|
Create Sequence Statistics (
)|
Create Sequence Statistics (![]() )
)
This opens a dialog where you can alter your choice of sequences which you want to create statistics for. You can also add sequence lists.
Note! You cannot create statistics for DNA and protein sequences at the same time.
When the sequences are selected, click Next.
This opens the dialog displayed in figure 14.15.
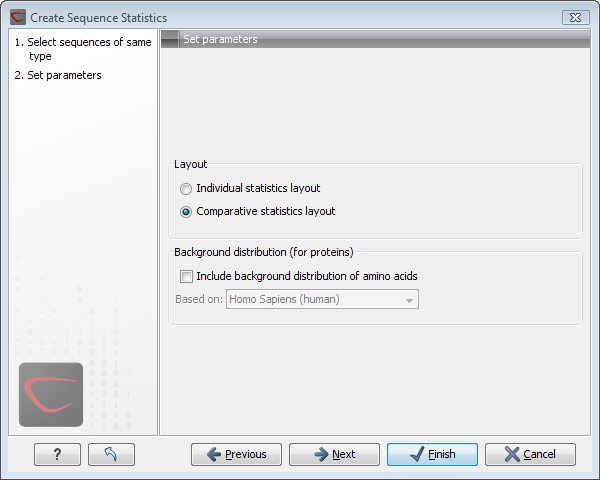
Figure 14.15: Setting parameters for the sequence statistics.
The dialog offers to adjust the following parameters:
- Individual statistics layout. If more sequences were selected in Step 1, this function generates separate statistics for each sequence.
- Comparative statistics layout. If more sequences were selected in Step 1, this function generates statistics with comparisons between the sequences.
You can also choose to include Background distribution of amino acids. If this box is ticked, an extra column with amino acid distribution of the chosen species, is included in the table output. (The distributions are calculated from UniProt www.uniprot.org version 6.0, dated September 13 2005.)
Click Next if you wish to adjust how to handle the results. If not, click Finish. An example of protein sequence statisticsis shown in figure 14.16.
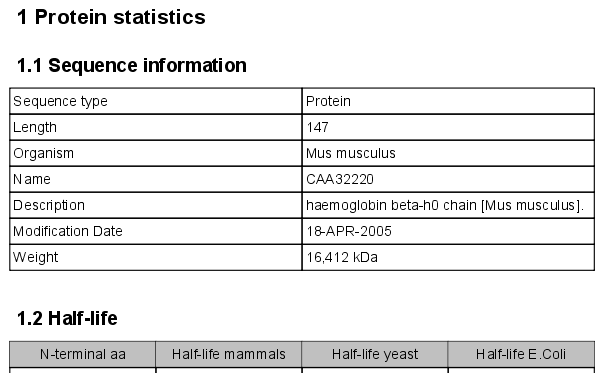
Figure 14.16: Comparative sequence statistics.
Nucleotide sequence statistics are generated using the same dialog as used for protein sequence statistics. However, the output of Nucleotide sequence statistics is less extensive than that of the protein sequence statistics.
Note! The headings of the tables change depending on whether you calculate 'individual' or 'comparative' sequence statistics.
The output of comparative protein sequence statistics include:
- Sequence information:
- Sequence type
- Length
- Organism
- Name
- Description
- Modification Date
- Weight. This is calculated like this:
 where
where linksis the sequence length minus one andunitsare amino acids. The atomic composition is defined the same way. - Isoelectric point
- Aliphatic index
- Half-life
- Extinction coefficient
- Counts of Atoms
- Frequency of Atoms
- Count of hydrophobic and hydrophilic residues
- Frequencies of hydrophobic and hydrophilic residues
- Count of charged residues
- Frequencies of charged residues
- Amino acid distribution
- Histogram of amino acid distribution
- Annotation table
- Counts of di-peptides
- Frequency of di-peptides
The output of nucleotide sequence statistics include:
- General statistics:
- Sequence type
- Length
- Organism
- Name
- Description
- Modification Date
- Weight. This is calculated like this:
where
linksis the sequence length minus one for linear sequences and sequence length for circular molecules. Theunitsare monophosphates. Both the weight for single- and double stranded molecules are includes. The atomic composition is defined the same way.
- Atomic composition
- Nucleotide distribution table
- Nucleotide distribution histogram
- Annotation table
- Counts of di-nucleotides
- Frequency of di-nucleotides
A short description of the different areas of the statistical output is given in Bioinformatics explained: Protein statistics.
Subsections