Extract and count tags
First step in the analysis is to import the data (see Import Sequencing Data).
The next step is to extract the tags and count them:
Toolbox | Transcriptomics Analysis (![]() ) | Expression Profiling by Tags (
) | Expression Profiling by Tags (![]() ) | Extract and Count Tags (
) | Extract and Count Tags (![]() )
)
This will open a dialog where you select the reads that you have imported. Click Next when the sequencing data is listed in the right-hand side of the dialog.
This dialog is where you define the elements in your reads. An example is shown in figure 27.16.
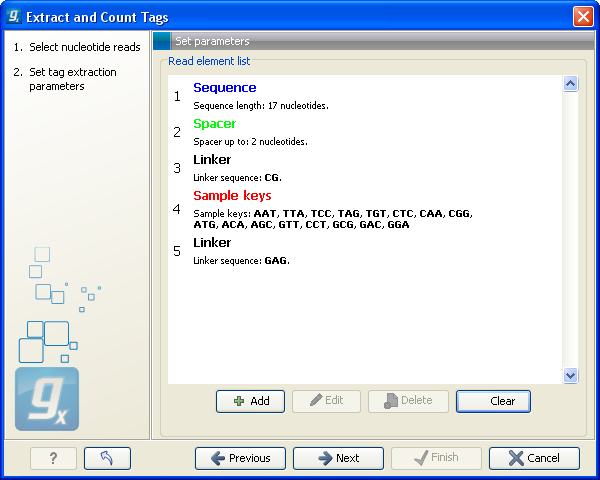
Figure 27.16: Defining the elements that make up your reads.
By defining the order and size of each element, the Workbench is now able to both separate samples based on bar codes and extract the tag sequence (i.e. removing linkers, bar codes etc). The elements available are:
- Sequence
- This is the part of the read that you want to use as your final tag for counting and annotating. If you have tags of varying lengths, add a spacer afterwards (see below).
- Sample keys
- Here you input a comma-separated list of the sample keys used for identifying the samples (also referred to as "bar codes"). If you have not pooled and bar coded your data, simply omit this element.
- Linker
- This is a known sequence that you know should be present and do not want to be included in your final tag.
- Spacer
- This is also a sequence that you do not want to include in your final tag, but whereas the linker is defined by its sequence, the spacer is defined by its length. Note that the length defines the maximum length of the spacer. Often not all tags will be exactly the same length, and you can use this spacer as a buffer for those tags that are longer than what you have defined as your sequence. In the example in figure 27.16, the tag length is 17 bp, but a spacer is added to allow tags up to 19 bp. Note that the part of the read that is extracted and used as the final tag does not include the spacer sequence. In this way you homogenize the tag lengths which is usually desirable because you want to count short and long tags together.
When you have set up the right order of your elements, click Next to set parameters for counting tags as shown in figure 27.17.
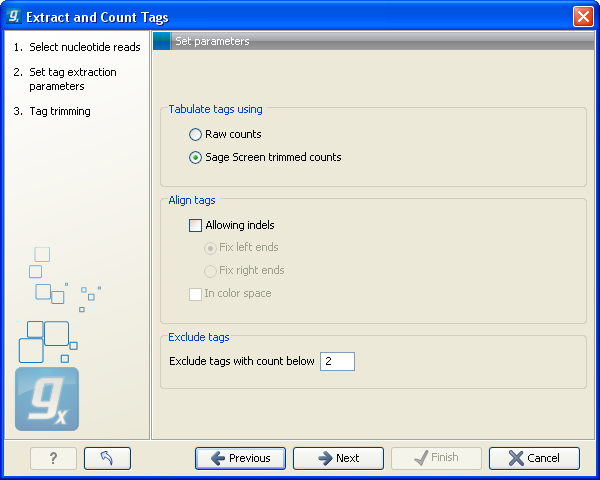
Figure 27.17: Setting parameters for counting tags.
At the top, you can specify how to tabulate (i.e. count) the tags:
- Raw counts
- This will produce the count for each tag in the data.
- Sage Screen trimmed counts
- This will produce trimmed tag counts. The trimmed tag counts are obtained by applying an implementation of the SAGEscreen method ([Akmaev and Wang, 2004]) to the raw tag counts. In this procedure, raw counts are trimmed using probabilistic reasoning. In this procedure, if a tag with low count has a neighboring tag with high count, and it is likely, based on the estimated mutation rate, that the low count tags have arisen through sequencing errors of the tags with higher count, the count of the less abundant tag will be attributed to the higher abundant neighboring tag. The implementation of the SAGEscreen method is highly efficient and provides considerable speed and memory improvements.
- Allowing indels
- Ticking this box means that, when SAGEscreen is applied, neighboring tags will, in addition to tags which differ by nucleotide substitutions, also include tags with insertion or deletion differences.
- Color space
- This option is only available if you use data generated on the SOLiD platform. Checking this option will perform the alignment in color space which is desirable because sequencing errors can be corrected. Learn more about color space in Color space.
Note! If more samples are created, SAGEscreen and the minimum threshold cut-offs will be applied to the cumulated counts (i.e. all tags for all samples).
Clicking Next allows you to specify the output of the analysis as shown in figure 27.18.
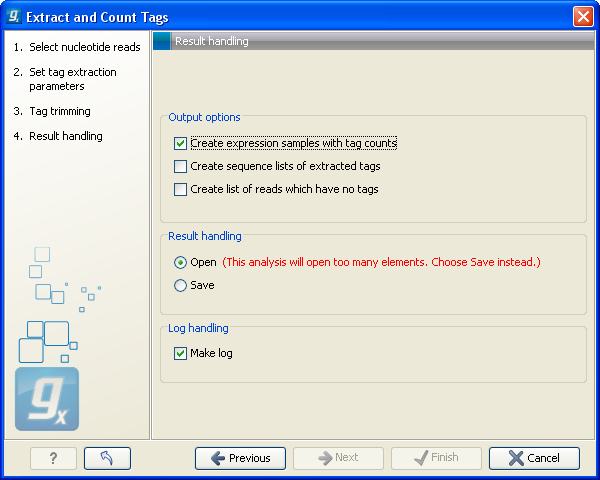
The options are:
- Create expression samples with tag counts
- This is the primary result showing all the tags and respective counts (an example is shown in figure 27.19). For each sample defined via the bar codes, there will be an expression sample like this. Note that all samples have the same list of tags, even if the tag is not present in the given sample (i.e. there will be tags with count 0 as shown in figure 27.19). The expression samples can be used in further analysis by the expression analysis tools for statistical analyses etc.
- Create sequence lists of extracted tags
- This is a simple sequence list of all the tags that were extracted. The list is simple with no counts or additional information.
- Create list of reads which have no tags
- This list contains the reads from which a tag could not be extracted. This is most likely bad quality reads with sequencing errors that make them impossible to group by their bar codes. It can be useful for troubleshooting if the amount of real tags is smaller than expected.
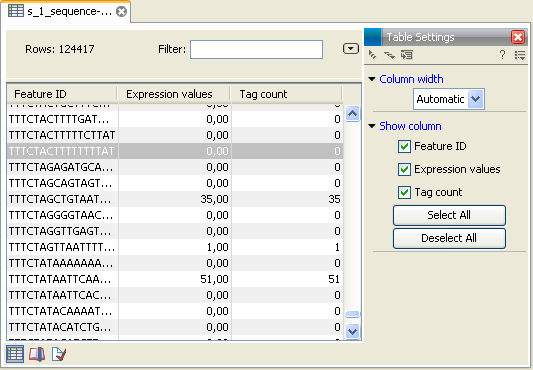
Figure 27.19: The tags have been extracted and counted.
Finally, a log can be shown of the extraction and count process. The log gives useful information such as the number of tags in each sample and the number of reads without tags.