Extract and count
First step in the analysis is to import the data (see Import Sequencing Data).
The next step is to extract and count the small RNAs to create a small RNA sample that can be used for further analysis (either annotating or analyzing using the expression analysis tools):
Toolbox | Transcriptomics Analysis (![]() ) | Small RNA Analysis (
) | Small RNA Analysis (![]() ) | Extract and Count (
) | Extract and Count (![]() )
)
This will open a dialog where you select the sequencing reads that you have imported. Click Next when the sequencing data is listed in the right-hand side of the dialog. Note that if you have several samples, they should be processed separately.
This dialog (see figure 27.29) is where you specify whether the reads should be trimmed for adapter sequences prior to counting. It is often necessary to trim off remainders of adapter sequences from the reads before counting.
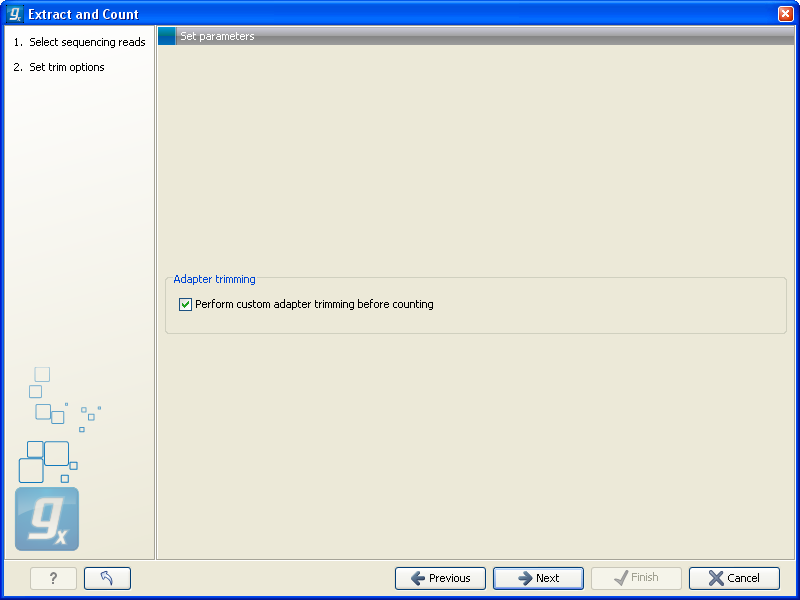
Figure 27.29: Specifying whether adapter trimming is needed.
When you click Next, you will be able to specify how the trim should be performed as shown in figure 27.30.
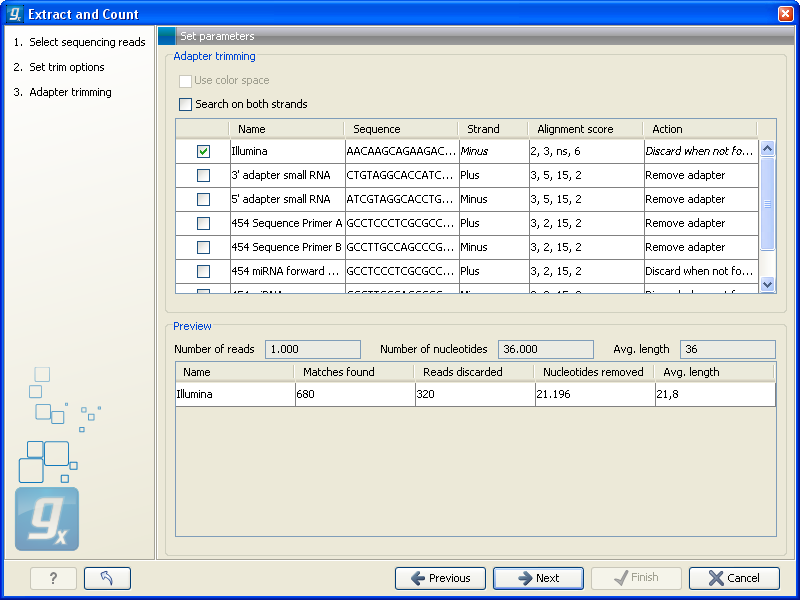
Figure 27.30: Setting parameters for adapter trim.
If you have chosen not to trim the reads for adapter sequence, you will see figure 27.31 instead.
The trim options shown in figure 27.30 are the same as described under Adapter trimming. Please refer to this section for more information.
It should be noted that if you expect to see part of adapters in your reads, you would typically choose Discard when not found as the action. By doing this, only reads containing the adapter sequence will be counted as small RNAs in the further analysis. If you have a data set where the adapter may be there or not you would choose Remove adapter.
Note that all reads will be trimmed for ambiguity symbols such as N before the adapter trim.
Clicking Next allows you to specify additional options regarding trimming and counting as shown in figure 27.31.
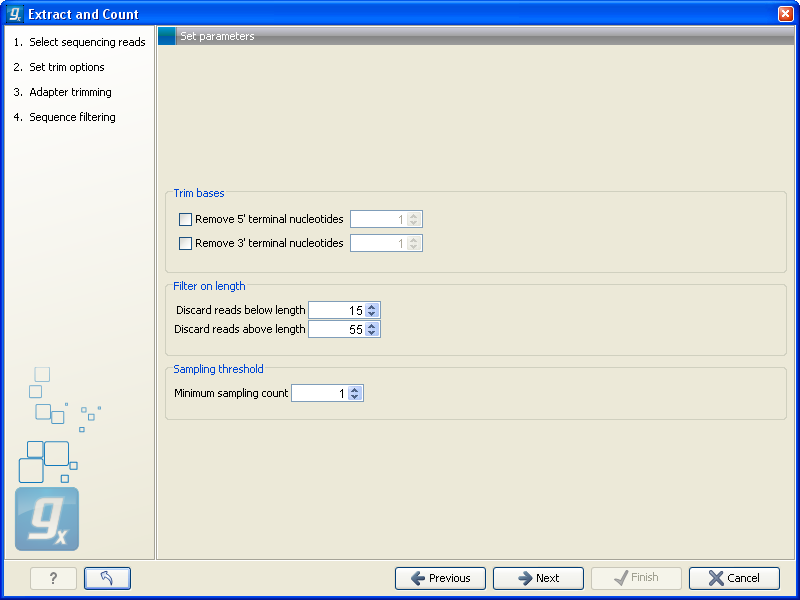
Figure 27.31: Defining length interval and sampling threshold.
At the top you can choose to Trim bases by specifying a number of bases to be removed from either the 3' or the 5' end of the reads. Below, you can specify the minimum and maximum lengths of the small RNAs to be counted (this is the length after trimming). The minimum length that can be set is 15 and the maximum is 55.
At the bottom, you can specify the Minimum sampling count. This is the number of copies of the small RNAs (tags) that are needed in order to include it in the resulting count table (the small RNA sample). The actual counting is very simple and relies on perfect match between the reads to be counted together27.3. This also means that a count threshold of 1 will include a lot of unique tags as a result of sequencing errors. In order to set the threshold right, the following should be considered:
- If the sample is going to be annotated, annotations may be found for the tags resulting from sequencing errors. This means that there is no negative effect of including tags with a low count in the output.
- When using un-annotated sequences for discovery of novel small RNAs, it may be useful to apply a higher threshold to eliminate the noise from sequencing errors. However, this can be done at a later stage by filtering the sample and creating a sub-set.
- When multiple samples are compared, it is interesting to know if one tag which is abundant in one sample is also found in another, even at a very low number. In this case, it is useful to include the tags with very low counts, since they may become more trustworthy in combination with information from other samples.
- Setting the count threshold higher will reduce the size of the sample produced which will reduce the memory and disk usage when working with the results.
Clicking Next allows you to specify the output of the analysis as shown in 27.32.
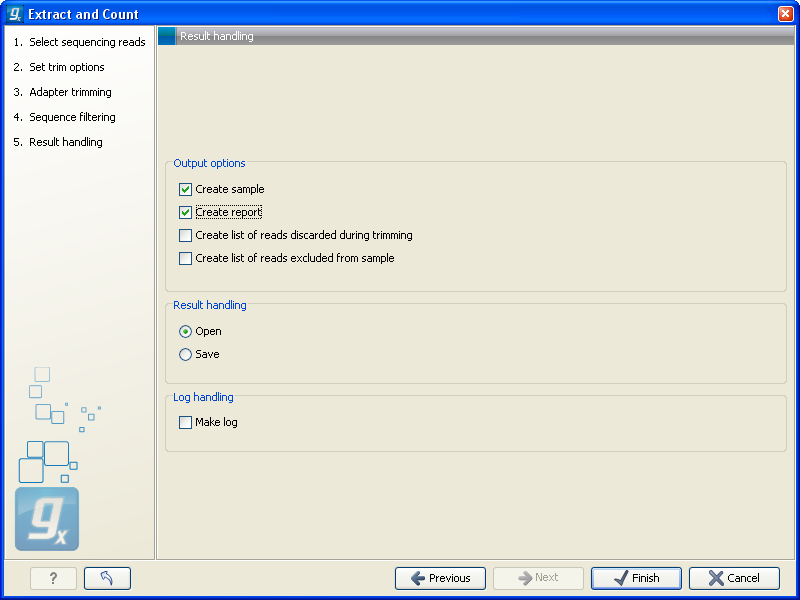
The options are:
- Create sample
- This is the primary result showing all the tags and respective counts (an example is shown in figure 27.33). Each row represents a tag with the actual sequence as the feature ID and a column with Length and Count. The actual count is based on 100 % similarity27.4. The sample can be used in further analysis by the tools of the Transcriptomics Analysis toolbox in the "raw" form, or you can annotate it using the Annotate and Merge Counts tool. The tools for working with the data in the sample are described in Working with the small RNA sample.
- Create report
- This will create a summary report as described below.
- Create list of reads discarded during trimming
- This list contains the reads where no adapter was found (when choosing Discard when not found as the action).
- Create list of reads excluded from sample
- This list contains the reads that passed the trimming but failed to meet the sampling thresholds regarding minimum/maximum length and number of copies.
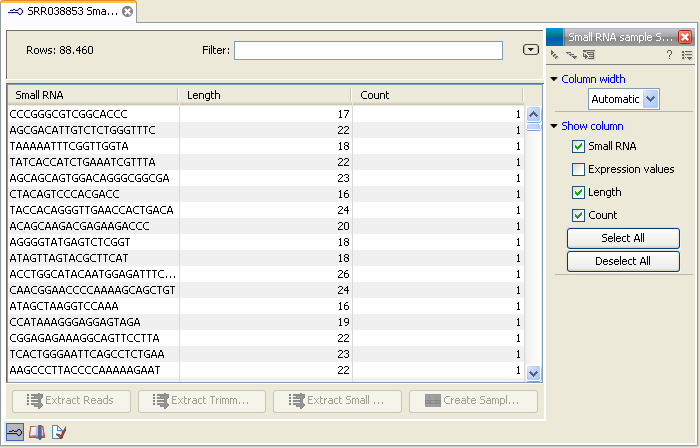
Figure 27.33: The tags have been extracted and counted.
The summary report includes the following information (an example is shown in figure 27.34):
- Trim summary
- Shows the following information for each input file:
- Number of reads in the input.
- Average length of the reads in the input.
- Number of reads after trim. The difference between the number of reads in the input and this number will be the number of reads that are discarded by the trim.
- Percentage of the reads that pass the trim.
- Average length after trim. When analyzing miRNAs, you would expect this number to be around 22. If the number is significantly lower or higher, it could indicate that the trim settings are not right. In this case, check that the trim sequence is correct, that the strand is right, and adjust the alignment scores. Sometimes it is preferable to increase the minimum scores to get rid of low-quality reads. The average length after trim could also be somewhat larger than 22 if your sequenced data contains a mixture of miRNA and other (longer) small RNAs.
- Read length before/after trimming
- Shows the distribution of read lengths before and after trim. The graph shown in figure 27.34 is typical for miRNA sequencing where the read lengths after trim peaks at 22 bp.
- Trim settings
- The trim settings summarized. Note that ambiguity characters will automatically be trimmed.
- Detailed trim results
- This is described under Adapter trimming.
- Tag counts
- The number of tags and two plots showing on the x-axis the counts of tags and on the y-axis the number of tags for which this particular count is observed. The plot is in a zoomed version where only the lower part of the y-axis is shown to make it possible to see the numbers of tags higher counts.
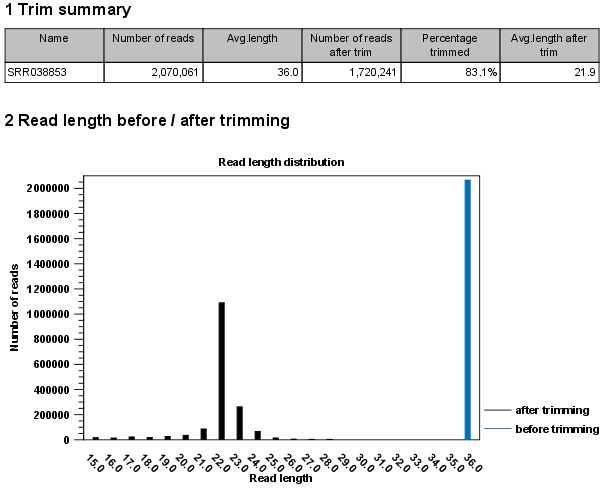
Figure 27.34: A summary report of the counting.
Footnotes
- ... together27.3
- Note that you can identify variants of the same miRNA when annotating the sample.
- ... similarity27.4
- Note that you can identify variants of the same miRNA when annotating the sample.